Join Our Telegram channel to stay up to date on breaking news coverage
Bitcoin Price Prediction – January 11
The Bitcoin price prediction bounces off the support at $41,274 as the coin moves close to the resistance level of $43,000 within the channel.
BTC/USD Long-term Trend: Bearish (Daily Chart)
Key levels:
Resistance Levels: $48,000, $50,000, $52,000
Support Levels: $37,000, $35,000, $33,000
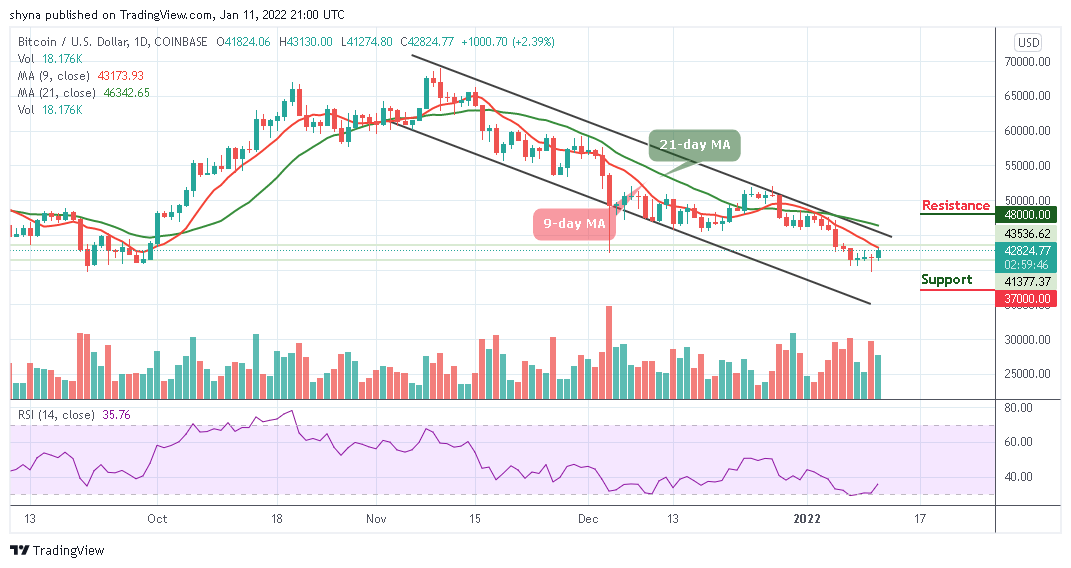
BTC/USD is currently trading around $42,824 with a 2.39% gain after the daily low at $41,274. According to the daily chart, the Bitcoin price may continue to fight to stay above the important level of $45,000 as it could move to cross above the 9-day moving average. However, for BTC/USD to remain above this barrier for the next few days, the bulls need to make the $42,000 support level to be strong.
Bitcoin Price Prediction: Bitcoin (BTC) May Spike Higher
At the time of writing, the Bitcoin price is seen moving to cross above the 9-day moving average, and if it breaks above the upper boundary of the channel, BTC/USD could touch the nearest resistance level of $46,000. Moreover, the king coin needs to claim this important resistance level to head to the upside.
However, looking at the Relative Strength Index (14), the signal line is likely to cross above 40-level, but the recovery may not come easy, and traders must be aware that support will have to be sort above $45,000 while other important levels could be located at $48,000, $50,000, and $52,000 resistance levels.
Meanwhile, despite the current movement, the RSI (14) is likely to return into the oversold region which means there may still be a room that could be explored by the bears. If this happens, the supports at $37,000, $35,000, and $33,000 may likely come to focus.
BTC/USD Medium – Term Trend: Bearish (4H Chart)
On the 4-hour chart, the technical indicator Relative Strength Index (14) stays below 60-level and may likely nosedives to the south to begin a downward movement. However, the chart reveals that there is a little bullish movement within the market as the technical indicator could face the upside.
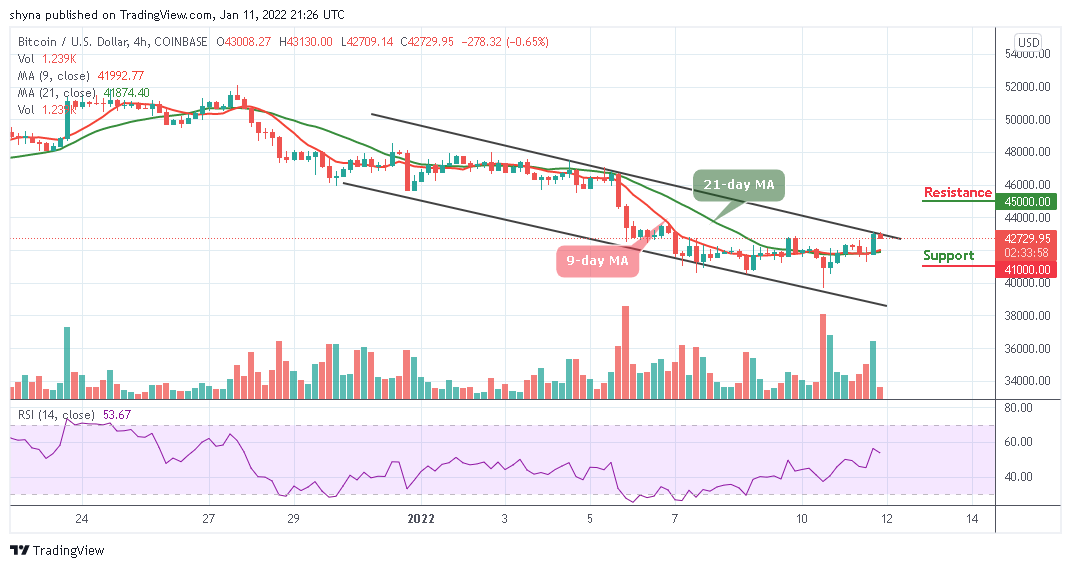
However, if the Bitcoin price continue to move and break above the upper boundary of the channel, it is likely for the market price to reach the potential resistance at $45,000 and above. On the contrary, if the current market value drops below the 9-day and 21-day moving averages, it may touch the support at $41,000 and below.
Looking to buy or trade Bitcoin (BTC) now? Invest at eToro!
68% of retail investor accounts lose money when trading CFDs with this provider
Read more:
Join Our Telegram channel to stay up to date on breaking news coverage