Join Our Telegram channel to stay up to date on breaking news coverage
Bitcoin Price Prediction – November 21
The Bitcoin price is likely to see additional sharp drops as the seller hits most of the other cryptocurrencies in the market.
BTC/USD Long-term Trend: Bearish (Daily Chart)
Key levels:
Resistance Levels: $63,000, $65,000, $67,000
Support Levels: $50,000, $48,000, $46,000

Looking at the daily chart, BTC/USD is once again falling below $58,000 with a loss of around 4.50% from the opening price to reach the $56,028 level at the time of writing. More so, the cryptocurrency previously touched the resistance level of $59,526, which caused it to reverse and fall below the 9-day and 21-day moving averages. Such a noticeable drop in prices may raise doubts among the cryptocurrency community, as the drop could affect other cryptos as well.
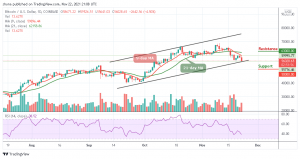
Bitcoin Price Prediction: Bitcoin Price Ready to Drop Further
The Bitcoin price is seen dropping below the previous rising price as the bearish movement increases. It does look like Bitcoin might be headed back towards $52,000 in the next few negative days of trading. Therefore, if it breaks beneath $51,500 support, the king coin may find support below the lower boundary of the channel.
Moreover, the Bitcoin price remains within the channel but it is in extreme danger of turning more bearish and if this is the case, traders can expect support below the lower boundary of the channel at $50,000, $48,000, and $46,000 levels as the Relative Strength Index (14) nosedives below 40-level. On the contrary, any bullish movement above the 9-day and 21-day MAs could locate the resistance levels at $63,000, $65,000, and $67,000. `
BTC/USD Medium-Term Trend: Bearish (4H Chart)
Looking at the 4-hour chart, the Bitcoin price is seen following the downward trend, bringing its price from $56,391 to reach around $55,641. If the price continues to drop further and moves below the lower boundary of the channel, it could reach the nearest supports at $53,000, $51,000, and $49,000 respectively.
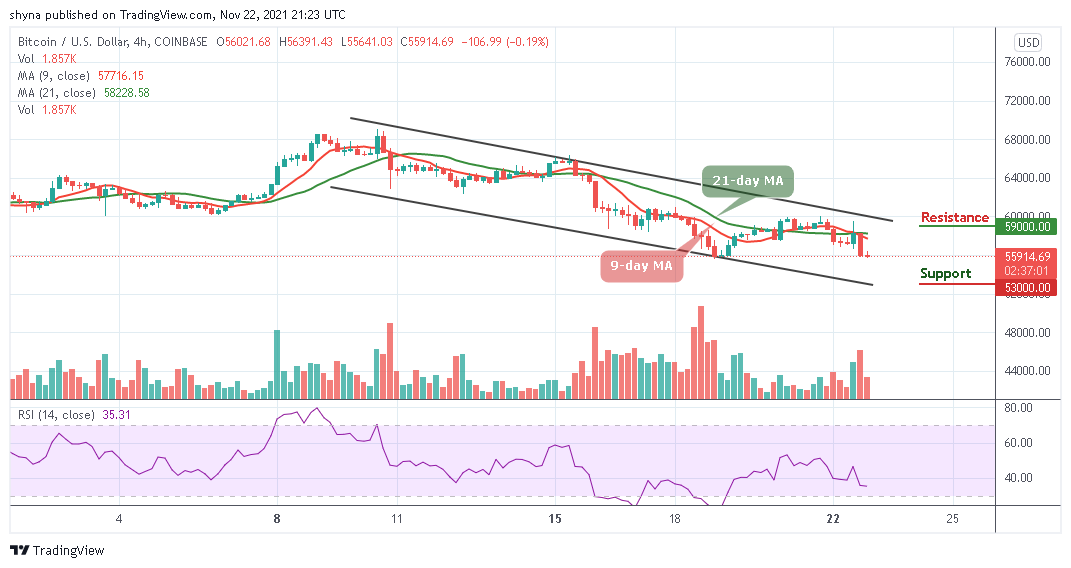
Moreover, if the bulls push the coin above the 9-day and 21-day moving averages, the price of Bitcoin may likely reach the potential resistance levels of $59,000, $61,000, and $63,000 as the technical indicator Relative Strength Index (14) is heading towards the oversold region.
Looking to buy or trade Bitcoin (BTC) now? Invest at eToro!
68% of retail investor accounts lose money when trading CFDs with this provider
Read more:
Join Our Telegram channel to stay up to date on breaking news coverage