Join Our Telegram channel to stay up to date on breaking news coverage
Bitcoin (BTC) Price Prediction – November 6
Bitcoin price is stuck within a strong resistance zone between $9,150 and $9,550. Correction above $9,350 will stir up action towards $9,800.
BTC/USD Long-term Trend: Ranging (Daily Chart)
Key levels:
Resistance Levels: $10,000, $10,300, $10,500
Support Levels: $8,850, $8, 650, $8,450

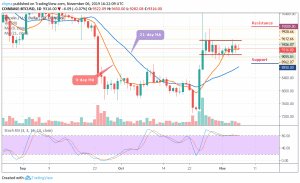
Bitcoin bulls are slowly coming back in action after a minor battering from the bears. BTC/USD explored lows under $9,300 during the Asian trading hours. The price has since adjusted upwards to $9,324. The prevailing trend is bullish while the volatility is expanding. Bitcoin price is currently correcting downwards above the 9-day and 21-day moving averages as it failed to settle at $9,400 and above.
Although the bulls seem to be flexing their muscles upwards, they are also staring into a critical resistance zone at $9,295.46 to $9,392. If Bitcoin bulls manage to clear the above resistance, they are likely to gather overwhelming support to catapult them towards the resistance levels of $10,000, $10,300 and $10,500. The confluence tool shows the existence of mild hurdles between $9,400 and $10,100.
On the downside, the beginning of the resistance zone $9,296 is playing a double function as a support. So, in the case of a reversal and extended declines, BTC/USD price may likely find supports at $8,850, $8, 650 and $8,450. The stochastic RSI continued to trend in the same direction at the overbought zone with an indication of indecisive in the market.
BTC/USD Medium-Term Trend: Bullish (4H Chart)
The four-hour chart for Bitcoin is still looking bullish, but the market has been showing a sign of weakness since the daily opening. However, the intraday trading was looking bullish; following the recent rebound at $9,306 which is now a key support level. The next key support levels are $9,150, $9,050 and $8,900.
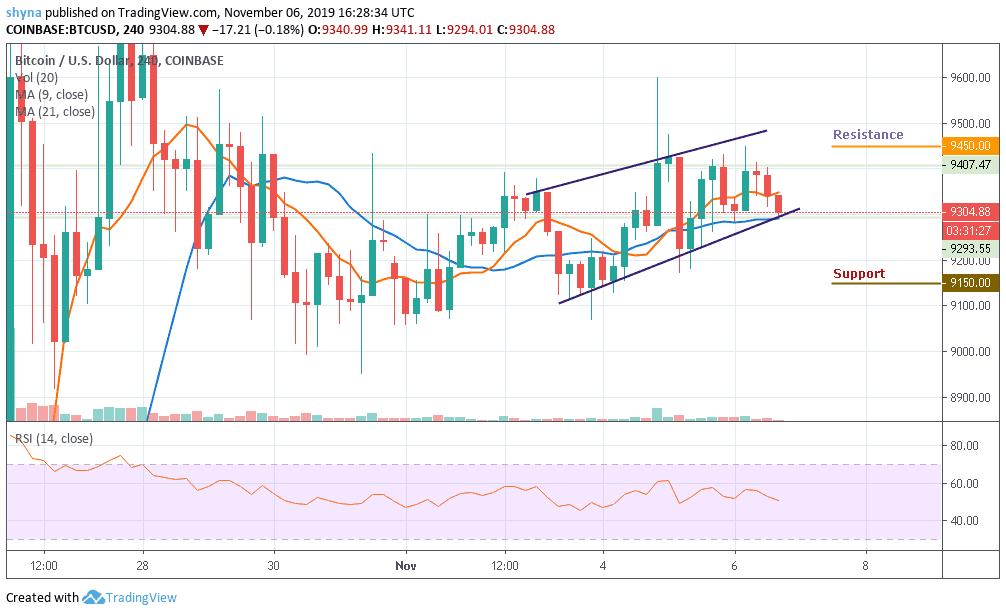
However, considering the recent sharp rebound, the Bitcoin price may re-enter the bullish rally to $9,400 resistance. A climb above the mentioned resistance may further push BTC price to $9,450, $9,550 and $9,650 resistance levels. As it appeared now, it seems the bears are returning in the market as the RSI (14) is now revealed in a downward direction after seeing a price reduction, a fall back is likely.
Please note: Insidebitcoins.com is not a financial advisor. Do your research before investing your funds in any financial asset or presented product or event. We are not responsible for your investing results.
Join Our Telegram channel to stay up to date on breaking news coverage