Join Our Telegram channel to stay up to date on breaking news coverage
Bitcoin (BTC) Price Prediction – April 3
The Bitcoin (BTC) has recovered from the recent low on approach to $6,700 but the Bulls may have trouble taking the price above $7,000.
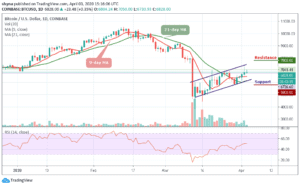
BTC/USD Long-term Trend: Bullish (Daily Chart)
Key levels:
Resistance Levels: $7,800, $8,000, $8,200
Support Levels: $5,800, $5,600, $5,400

BTC/USD resumed the upside trend after a short-lived retreat to $6,736 during early Asian hours. At the time of writing, BTC is changing hands at $6,828 and the upside momentum is gaining traction. A sustainable move above $7,000 will bring $7,300 back into focus and improve the technical picture. The coin after touching $7,041 has gained nearly 2% since the beginning of the day but later moved back to touch 7,736.
Looking at the daily chart, BTC/USD is moving above the 9-day and 21-day moving averages. This area creates the first line support that may slow down the correction. Considering that the RSI (14) has reversed to the downside from around 51-level, However, BTC/USD may retest $6,900 before another attempt at $7,000 but if $6,800 is broken, the nearest support level of $6,600 may come into focus, followed by $6,500 that served as a strong resistance during the consolidation period at the beginning of the week.
Therefore, any failure by the bulls to move the price up, we may see a price cut to $6,500 vital support. A further low drive could send the price to $5,800, $5,600 and $5,400 supports. For now, the bulls are still controlling the market. But with a look of things, the Bitcoin price may continue to follow the upward trend in as much as the red-line of 9-day MA is above the green-line of 21-day MA.
BTC/USD Medium-Term Trend: Bullish (4H Chart)
At the opening of the market today, the Bitcoin price first went up to touch $7,053 but has dropped slightly within 24 hours, bringing its price to where it is currently trading at $6,718. Should the price continue to drop further and move below the 21-day moving average, it could reach the nearest support levels at $6,400 and beyond.
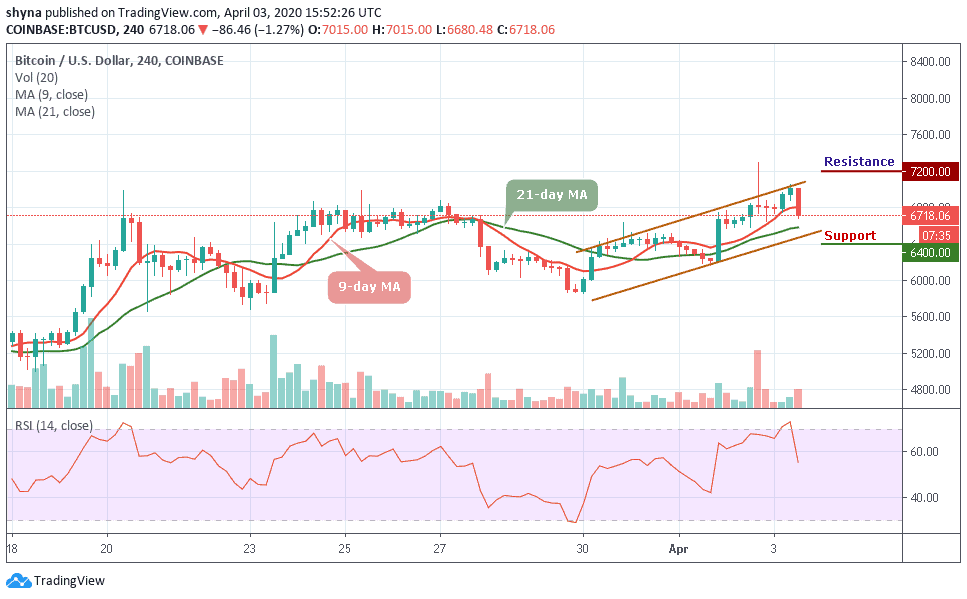
In other words, if the bulls intervene and push the coin above the moving averages, the price of Bitcoin may likely reach the potential resistance levels of $7,200 and above. Presently, the market may follow the downward trend as the RSI (14) indicator nosedives below the 55-level.
Please note: Insidebitcoins.com is not a financial advisor. Do your research before investing your funds in any financial asset or presented product or event. We are not responsible for your investing results.
Join Our Telegram channel to stay up to date on breaking news coverage