Join Our Telegram channel to stay up to date on breaking news coverage
Bitcoin Price Prediction (BTC) – May 18
The Bitcoin price movement is very fragile at the moment. Critical support levels must be monitored during a short-term breakout.
BTC/USD Long-term Trend: Bullish (Daily Chart)
Key levels:
Resistance Levels: $10,700, $10,900 $11,100
Support Levels: $8,600, $8,400, $8,200
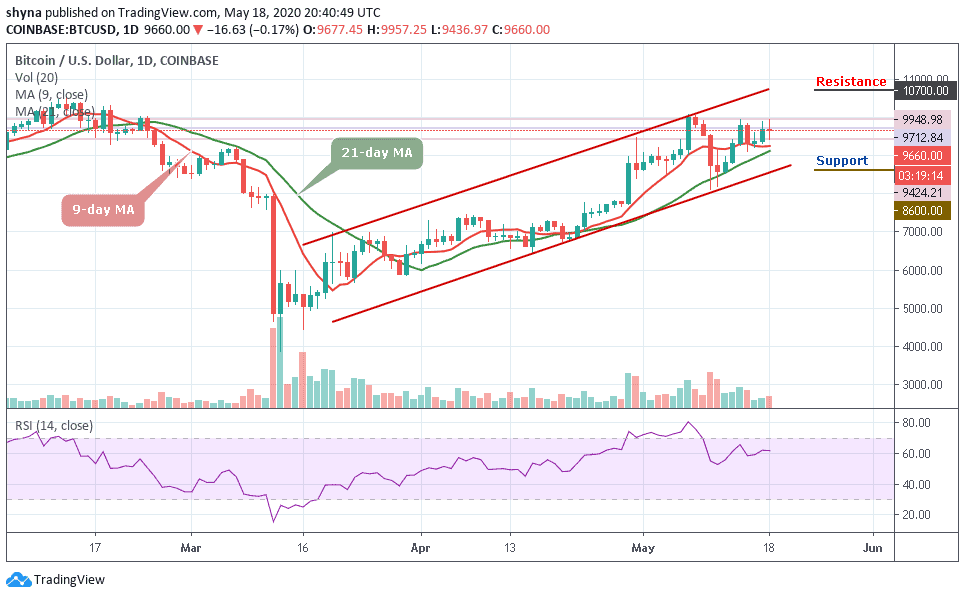
In a couple of weeks ago, BTC/USD has fallen as a result of a downward correction of the medium-term bear, which is steadily closing the vital support of $9,000. The market appears bearish on the daily chart after testing the $9,424 level today. The Bitcoin (BTC) is facing a slight drop after testing the immediate resistance of $9,948.98, with the selling pressure remaining strong.
However, if the price increases and Bitcoin manages to close well above the $9,700, we could see an upward price explosion, which could reach $10,000. A further increase could also reduce the price to $10,700, $10,900, and $11,000 resistance levels, a price at which traders could begin to consider an upward trend for the market.
Meanwhile, a break at the lower boundary of the ascending channel could lower Bitcoin price in long-term supports at $8,600, $8,400, and $8,200 respectively. The technical indicator RSI (14) is seen moving above 60-level, which is a good sign for the upward movement.
BTC/USD Medium-term Trend: Ranging (4H Chart)
Bitcoin trades downwards over the last 4 hours, fails to stay above $10,000. Currently, Bitcoin is correcting up from $6,438 with no gain in the last 4 hours. The coin is currently facing selling pressure within the ascending channel as it is seen trading at $9,676 and it remained above $9,600 at the time of writing.
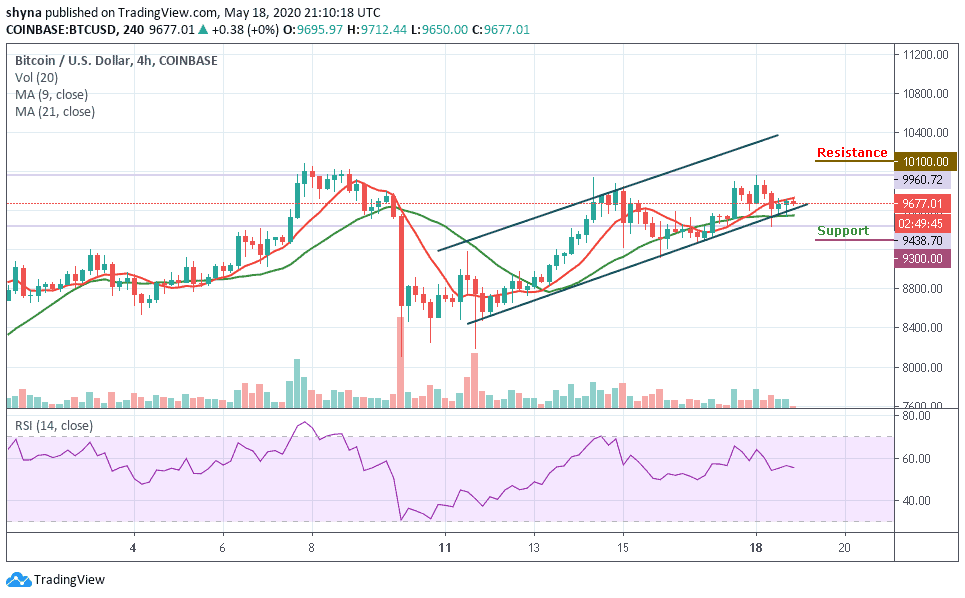
For now, the price keeps ranging around $10,868 to $10,612 and then breaks the support level near $9,500. The coin further dropped below the 9-day moving average. After a minor upward correction, the coin further tumbled to $9,561 and now rebounding as the technical indicator RSI (14) is moving around 56-level, suggesting a sideways movement.
Please note: Insidebitcoins.com is not a financial advisor. Do your research before investing your funds in any financial asset or presented product or event. We are not responsible for your investing results.
Join Our Telegram channel to stay up to date on breaking news coverage