Join Our Telegram channel to stay up to date on breaking news coverage
Bitcoin (BTC) Price Prediction – January 31
The Bitcoin price is struggling to recover above $9,500 against the USD but the coin remains at a risk of a larger breakdown below the $9,000 support.
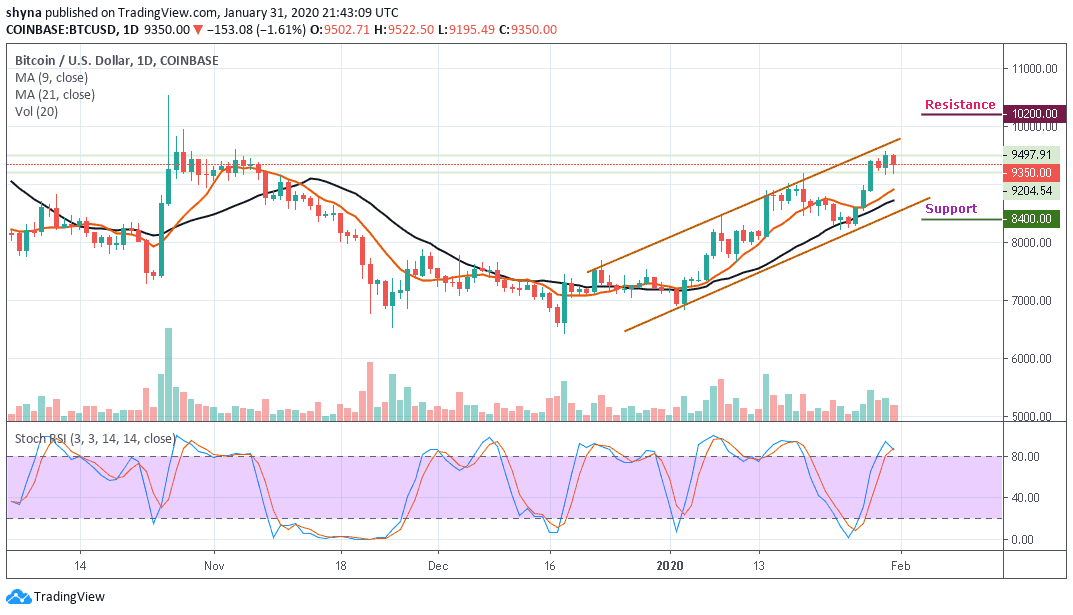
BTC/USD Long-term Trend: Bullish (Daily Chart)
Key levels:
Resistance Levels: $10,200, $10,400, $10,600
Support Levels: $8,400, $8,200, $8,000
At the time of writing, the BTC/USD price is trying to settle below $7,000, but what direction will BTC head next? The fact is that there is no consensus; since the BTC/USD bounced off a historic upward trend, it may likely enter back into a bull phase but if the coin tries to retest the $9,000 low, it may collapse further to form a longer-term bear sequence.
Moreover, as the coin is trading at $9,350 displaying an intraday loss of 1.89%. The prevailing trend is still bullish with expanding volatility. Meanwhile, a break down below the 9-day and 21-day moving averages may likely begin to form a new trend. In this case, Bitcoin could fall below $8,600 support and further movement may hit the critical supports at $8,400, $8,200 and $8,000.
However, should the bulls hold the price to remain above the moving averages and move up; the price could rise above the channel to hit $10,000 vital resistance. A further high drive could send the coin to $10,200, $10,400 and $10,600 resistance levels. More so, the stochastic RSI is still within the overbought zone, which indicates that a possible bearish momentum may play out.
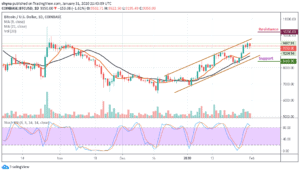
BTC/USD Medium – Term Trend: Ranging (4H Chart)
At the opening of the market today, the Bitcoin price has dropped over $150 within 24 hours, bringing its price from $9,509 to reach around $9,288. After the sudden fall, the coin started rising in price to where it’s trading currently at $9,353. Should the price continue to rise further and move above the channel, it could reach the nearest resistance at $9,600, $9,800 and $10,000 levels.

Moreover, if the bears push the coin below the 9-day and 21-day moving averages to cross below the lower boundary of the channel, the price of Bitcoin may likely touch the critical support levels of $9,100, $8,900 and $8,700. Presently, the market is indecisive as the RSI (14) indicator moves below the 60-level.
Please note: Insidebitcoins.com is not a financial advisor. Do your research before investing your funds in any financial asset or presented product or event. We are not responsible for your investing results.
Join Our Telegram channel to stay up to date on breaking news coverage