Join Our Telegram channel to stay up to date on breaking news coverage
Bitcoin (BTC) Price Prediction – February 4
The daily chart of Bitcoin (BTC) shows harsh pullback today while the month-long price path shows a gradual growth. Today’s price pullback has affected the majority of altcoins within the market.
BTC/USD Long-term Trend: Bullish (Daily Chart)
Key levels:
Resistance Levels: $9,700, $9,900, $10,100
Support Levels: $8,700, $8,500, $8,300
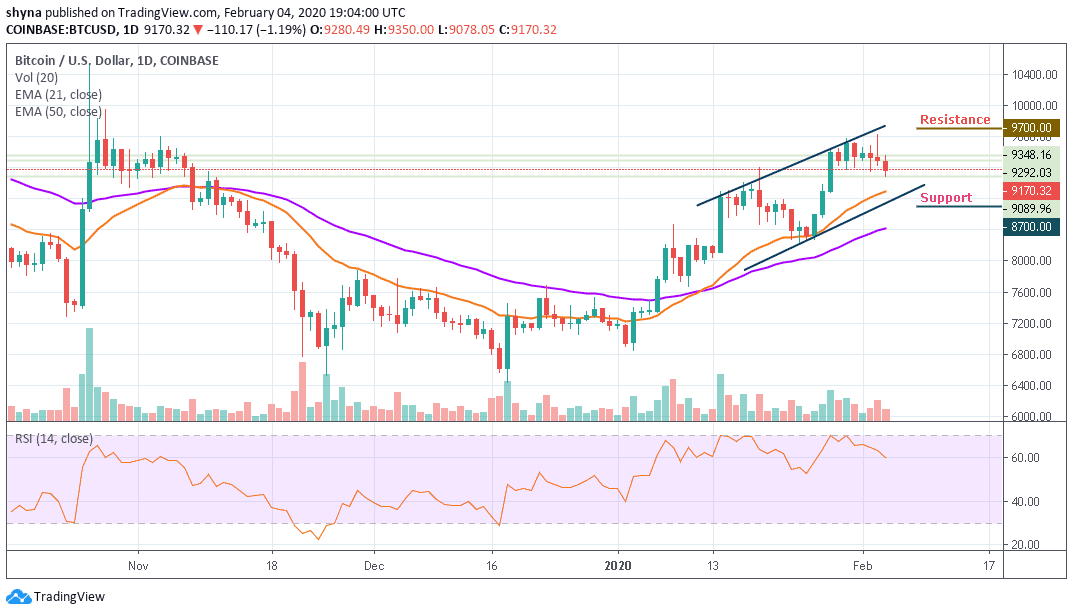
BTC/USD has put the traders under a nail-biting situation today as the coin kept heading downwards till just now. From its pulled-back price level of $9,089, BTC price has bounced up to $9200 with a rebound. The coin was above $9300 when the day opened, and the price correction drove the coin below $9200. Such notable price decline has triggered doubts amongst the crypto community as the decline has affected XRP and ETH to quite an extent.
Moreover, as the coin is trading at $8,281.29 and displays an intraday loss of 1.19%. The prevailing trend is bearish with expanding volatility. The leader of cryptocurrencies currently consolidates in a bullish flag pattern. Meanwhile, a breakout out from this pattern is supposed to continue in the direction of the previous trend. In this case, we expect BTC/USD to rise above $9,500 resistance and could move towards the potential resistance levels at $9,700, $9,900 and $10,100.
However, should Bitcoin price failed to remain above the 21 periods EMA; the price could drop to $8,900 vital support. A further low drive could send the price to $8,700, $8,500 and $8,300 support. The technical indicator RSI (14) has recently revealed a sign of trend reversal, which shows a possible more bearish momentum may continue to play out.
BTC/USD Medium – Term Trend: Ranging (4H Chart)
At the opening of the market today, the Bitcoin price first went up but has dropped slightly within 24 hours, bringing its price from $9,220 to reach around $9,150. Should the price continue to drop further and move below the channel, it could reach the nearest support levels at $8,900, $8,700 and $8,500.
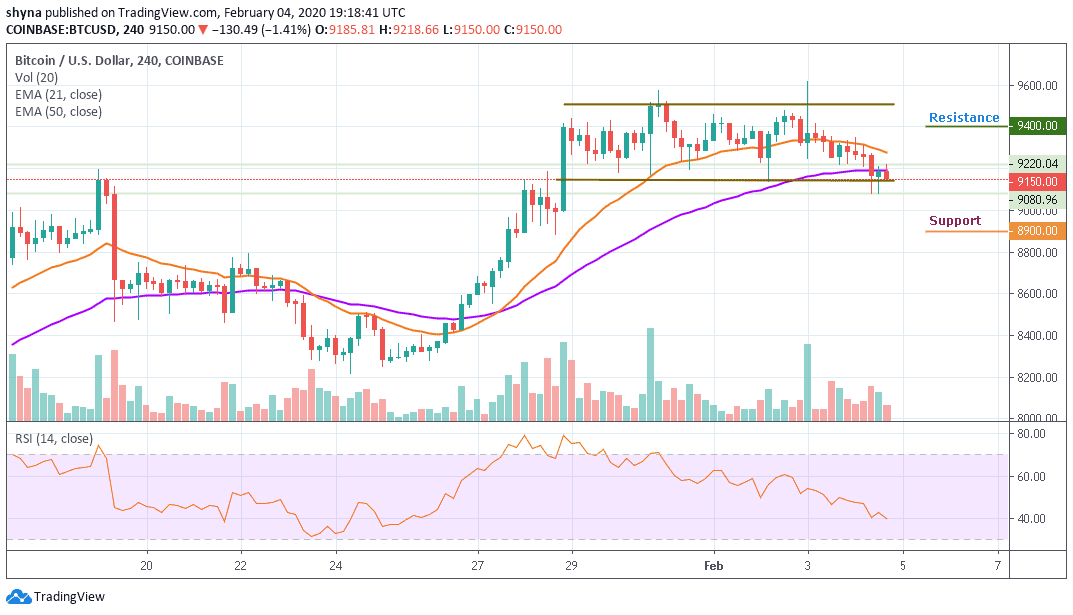
Moreover, if the bulls push the coin above the 21 and 50 periods EMA, the price of Bitcoin may likely reach the potential resistance levels of $9,400, $9,600 and $9,800. Presently, the market is indecisive as the RSI (14) indicator moves to cross below the 40-level.
Please note: Insidebitcoins.com is not a financial advisor. Do your research before investing your funds in any financial asset or presented product or event. We are not responsible for your investing results.
Join Our Telegram channel to stay up to date on breaking news coverage