Join Our Telegram channel to stay up to date on breaking news coverage
Bitcoin Price Prediction – September 22
After touching the monthly low of $39,600, the Bitcoin price prediction shows stability above $42,000 as traders wait for the next move.
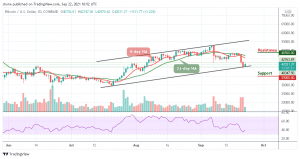
BTC/USD Long-term Trend: Ranging (Daily Chart)
Key levels:
Resistance Levels: $48,500, $50,500, $52,500
Support Levels: $35,000, $33,000, $31,000
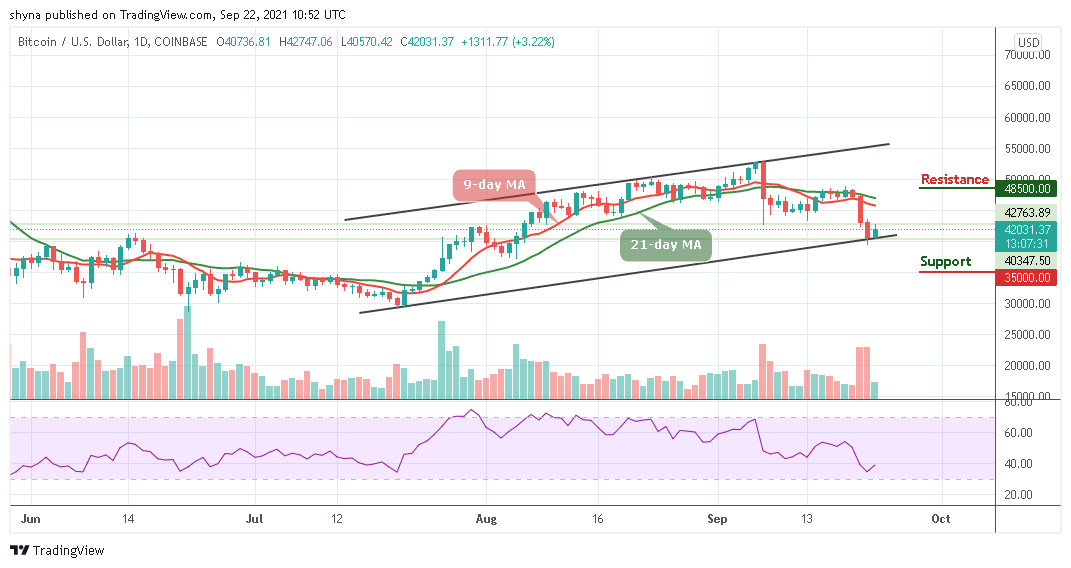
BTC/USD is currently rising towards the 9-day and 21-day moving averages as the recent move marks a breakthrough in the upward movement, but it is important to note that the Bitcoin price has not experienced any major technical level since the past few days. More so, the daily chart reveals that BTC/USD has been trying to start the upward move since yesterday but it is struggling to gain momentum as the uptrend of the entire market comes to a standstill.
Bitcoin Price Prediction: BTC Bulls May Hold Above $40,000
As revealed by the daily chart, the Bitcoin price successfully stays above the $40,000 level and continues to trade towards the 9-day and 21-day moving averages but still around the lower boundary of the channel. However, the coin may need to spike above the resistance level of $42,000 as the technical indicator Relative Strength Index (14) moves to cross above the 40-level.
Moreover, from a technical perspective, the king-coin has to fight off the first resistance at $45,000 before having a chance to aim at $48,500, $50,500, and $52,500 resistance levels. In other words, any bearish movement below the lower boundary of the channel could lead the coin to the support levels of $35,000, $33,000, and $31,000.
BTC/USD Medium – Term Trend: Bearish (4H Chart)
The 4-hour chart shows that Bitcoin (BTC) could be ready for a significant move to the upside. However, the price action since the past few hours forms a bullish movement on the 4-hour chart which appears to break out with a decent move towards $43,500. Similarly, the Relative Strength Index (14) is notably moving below 40-level, indicating that the bullish signals may come into play.
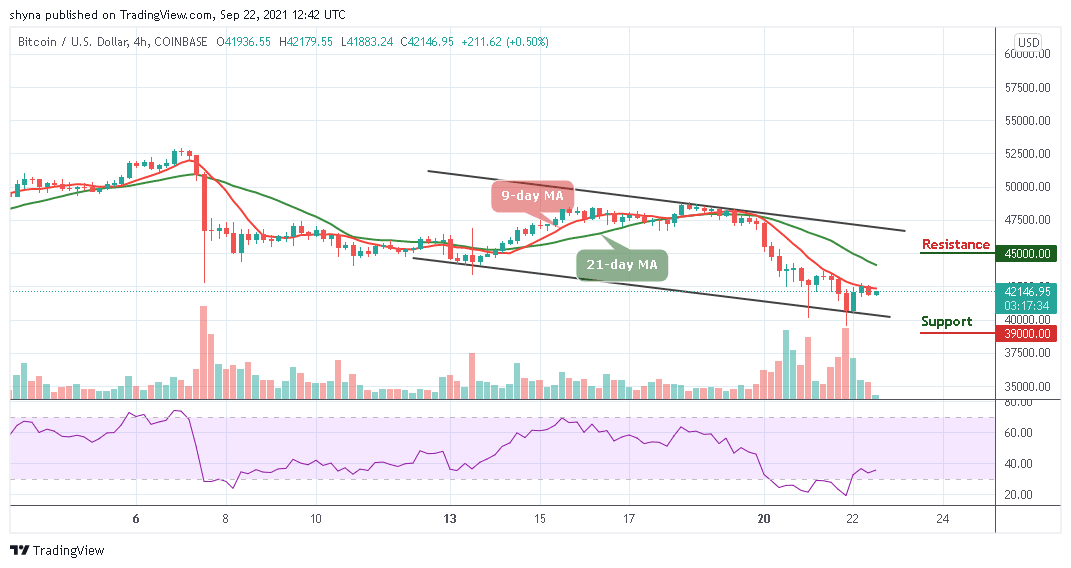
Meanwhile, the 9-day MA remains below the 21-day MA but an additional resistance level could be added to the current market value. However, any bullish movement above the 9-day and 21-day moving averages may likely push the Bitcoin price to hit the resistance level of $45,000 and above while the support level could be found at $39,000 and below.
Looking to buy or trade Bitcoin (BTC) now? Invest at eToro!
67% of retail investor accounts lose money when trading CFDs with this provider
Read more:
Join Our Telegram channel to stay up to date on breaking news coverage