Join Our Telegram channel to stay up to date on breaking news coverage
Bitcoin (BTC) Price Prediction – February 21
The cryptocurrency market has remained gloomy since the massive decline of February 19.
BTC/USD Long-term Trend: Bullish (Daily Chart)
Key levels:
Resistance Levels: $10,500, $10,700, $10,900
Support Levels: $8,800, $8,600, $8,400
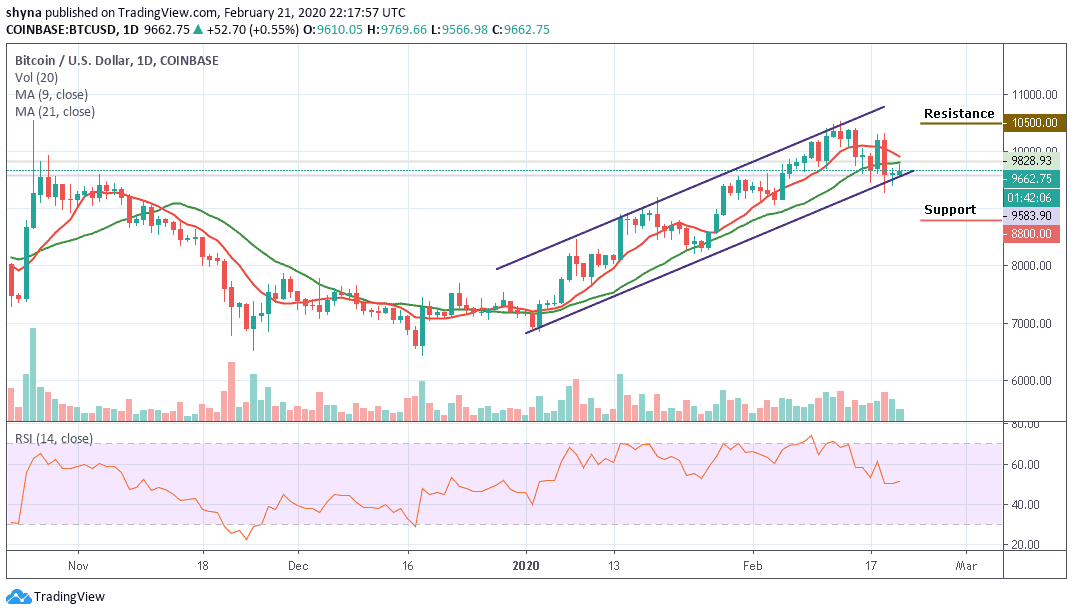
BTC/USD has been struggling to maintain its position above $9,800 and its price saw another dive below the $9,700 level today. The coin is in a dangerous position as the price trades around the support level of $9,600 but if the breakthrough is confirmed, then the downside momentum will gain traction with the next focus on $9,200. At the time of writing, Bitcoin is trading below the moving averages of 9-day and 21-day at the lower boundary of the channel.
Currently, the market price for BTC/USD and the daily candle is trading at $9,662 but has already touched the 21-day moving average. Further movement may push it to $10,200 but the next key resistance levels lies at $10,500, $10,700 and $10,900. Similarly, when the new uptrends are forming, traders may likely use the 9-day moving average as a pivot resistance point to gauge the strength of the trend.
More so, when price levels rise above the 9-day MA, this is a sign of sustainability and will likely result in a continuation of the newly formed trend. However, should the bulls failed to move the price upward; we may see a price cut to $9,000 vital support. A further low drive could send the price to $8,800, $8,600 and $8,400 supports. For now, the bulls are still defending critical support of $9,600. But as things stand, the BTC/USD price will rise as long as the RSI (14) move towards the north.
BTC/USD Medium – Term Trend: Ranging (4H Chart)
In today’s trading, Bitcoin’s price dropped to $9,562 before rebounding to $9,672 where it is currently trading now. Looking at the hourly price chart, we can see that the bearish supply is coming slowly in the market, but the bulls are also making an effort to defend the $9,500 support. Meanwhile, the $9,400 support level and below may come into play if BTC breaks the mentioned support.
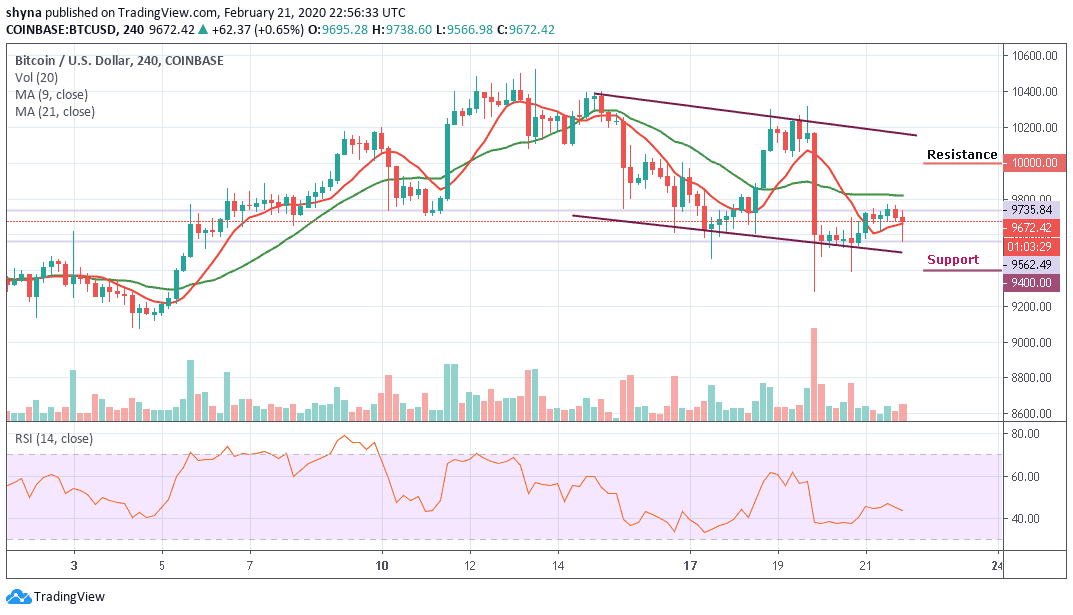
However, if the buyers can pressurize the market, we may expect a retest of $9,800 resistance level. Therefore, breaking the mentioned resistance could also allow the bulls to reach the potential resistance levels of $10,000, $10,200 and $10,400. However, BTC/USD is consolidating currently and moving in sideways on the medium-term outlook. We can expect an increase in volatility soon.
Please note: Insidebitcoins.com is not a financial advisor. Do your research before investing your funds in any financial asset or presented product or event. We are not responsible for your investing results.
Join Our Telegram channel to stay up to date on breaking news coverage