Join Our Telegram channel to stay up to date on breaking news coverage
The Bitcoin price prediction reveals that BTC is yet to gain strength above the 21-day moving average as the coin ranges.
Bitcoin Prediction Statistics Data:
- Bitcoin price now – $29,277
- Bitcoin market cap – $565.7 billion
- Bitcoin circulating supply – 19.3 million
- Bitcoin total supply – 19.3 million
- Bitcoin Coinmarketcap ranking – #1
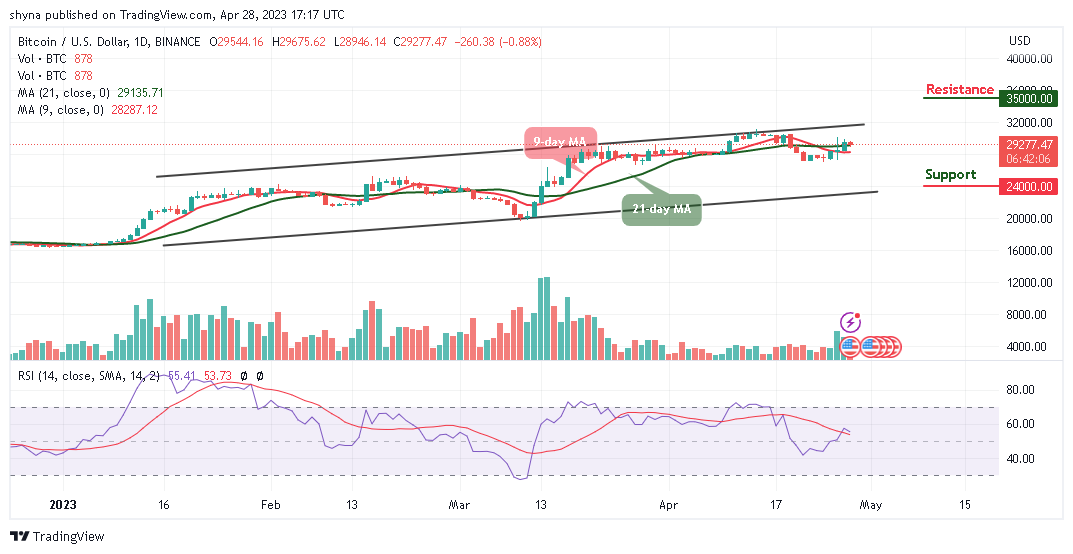
BTC/USD Long-term Trend: Ranging (Daily Chart)
Key levels:
Resistance Levels: $35,000, $37,000, $39,000
Support Levels: $24,000, $22,000, $20,000
After another failure to hit the resistance level of $30,000; BTC/USD is likely to slide under the 21-day moving average. Meanwhile, the Bitcoin price could begin another decline if bulls failed to push the coin to the upside. At the opening of today’s trading; the king coin touches the resistance level of $29,675, but any further bearish movement may bring the coin down to the bearish zone.
Bitcoin Price Prediction: Bitcoin (BTC) May Head to the South
As the Bitcoin price hovers within the moving averages, heading toward the lower boundary of the channel may increase the selling pressure. Therefore, if there are more losses, the price could break the major supports at $24,000, $22,000, and $20,000. Meanwhile, the technical indicator Relative Strength Index (14) moves below the 50-level, suggesting a bearish movement.
On the other hand, if the king coin crosses above the 21-day moving average; it could head toward the upper boundary of the channel and a clear break above this barrier may cause the coin to the resistance levels of $35,000, $37,000, and $39,000.
BTC/USD Medium-term Trend: Ranging (4H Chart)
According to the 4-hour chart, the coin may gain lost momentum if the coin moves to cross above the upper boundary of the channel. At the moment, the volatility is still low, and the selling pressure still exists as this could lead the coin to the downside. Meanwhile, the $27,000 and below may come into play if BTC breaks toward the lower boundary of the channel.
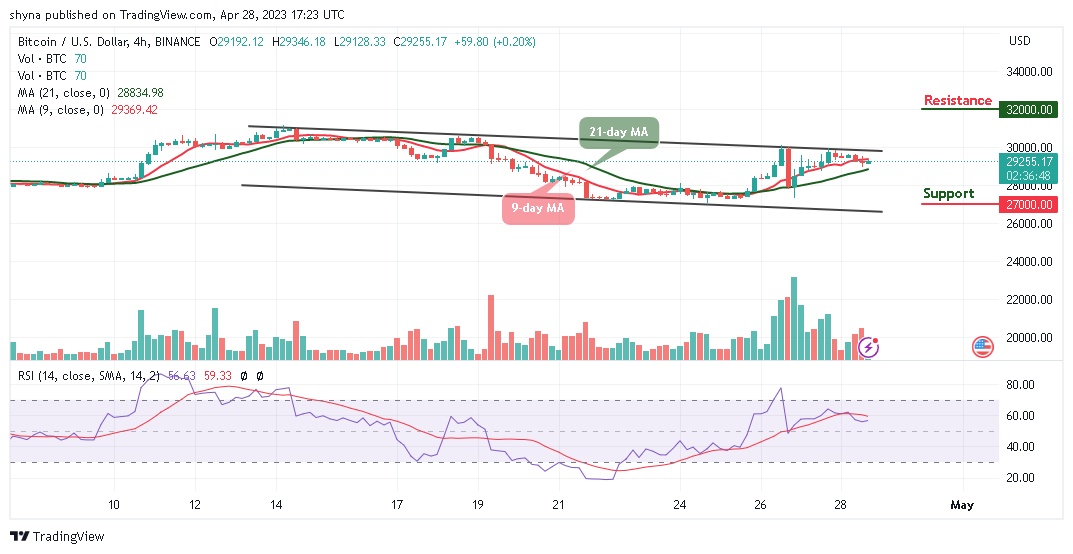
Meanwhile, if the buyers can reinforce and power the market, traders can expect a bullish cross above the upper boundary of the channel, and breaking this barrier may allow the bulls to reach the resistance level of $32,000 and above. The Relative Strength Index (14) is moving above the 50-level, which shows that the market could follow the bullish movement.
Bitcoin Alternatives
The Bitcoin price is currently changing hands at $29,277, however, where BTC trends next may partly depend on whether or not buyers can close today’s candle above the $30,000 level. Should in case this comes to play, the bulls may propel prices higher, and then traders may expect the king coin to create additional gains. However, Love Hate Inu is creating a safe space for people to share their opinions with other people who care what they think, and who don’t criticize them for having that opinion. From an investment standpoint, Love Hate Inu is a good buy as almost $9 million has been raised so far.
Join Our Telegram channel to stay up to date on breaking news coverage