Join Our Telegram channel to stay up to date on breaking news coverage
Bitcoin Price Analysis (BTC) – September 23
For more than 4 days now, Bitcoin (BTC) price has been trading below $10,000 and the next target support level could be $9,500.
BTC/USD Long-term Trend: Bearish (Daily Chart)
Key levels:
Resistance Levels: $10,700, $10,900 $11,100
Support Levels: $9,200, $9,000, $8,800
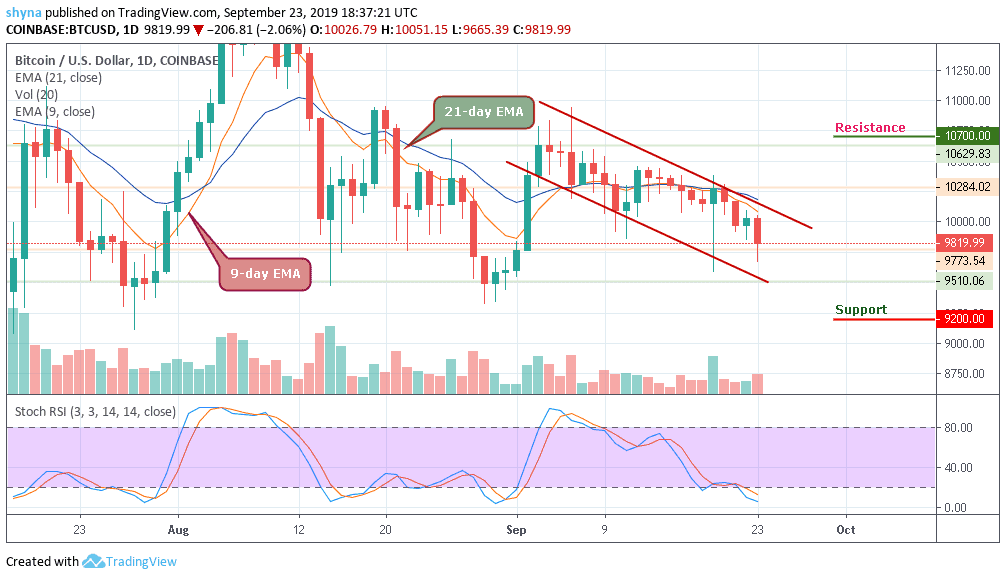
The BTC/USD pulled out of the $10,028 intraday peak and returned to the area below $10,000 under increasing pressure from the downtrend. At the time of writing this article, the BTC/USD is hovering around $9,819, with a short-term bearish bias. The coin has lost about 2.3% in the last 24 hours while the pair is being affected by the current slowdown in the entire crypto market and has halted all attempts to recover since the fall of last week.
As of now, Bitcoin is aiming to fall again, but the key support is becoming a threat to the bears. There are quite a number of technical levels clustered above the current price which means that the coin may be vulnerable to further losses at least as long as it stays below critical $10,000. BTC/USD pair may drop to $9,200, $9,000 and $8,800 supports if the $9,500 support fails to hold.
In the opposite direction, if critical support can continue to provide support for the market, definitely we can expect the Bitcoin price to come back to a resistance level of $10,300 before the market experience a rise far above the channel formation to reach the potential resistance levels at $10,700, $10,900 and $11,100 respectively. But as things stand, BTC is down and there is a high chance for a break than a bounce. The stochastic RSI is at the oversold zone, a further drop may cause the Bitcoin price to fall more but a buying pressure may visit the market soon.
BTC/USD Medium-term Trend: Bearish (4H Chart)
On the 4-hour chart, BTC/USD is moving inside a descending channel pattern. After falling to $9,814 support level on September 19, BTC saw a quick price jump to the upper boundary of the channel, from where the bear resume pressure.
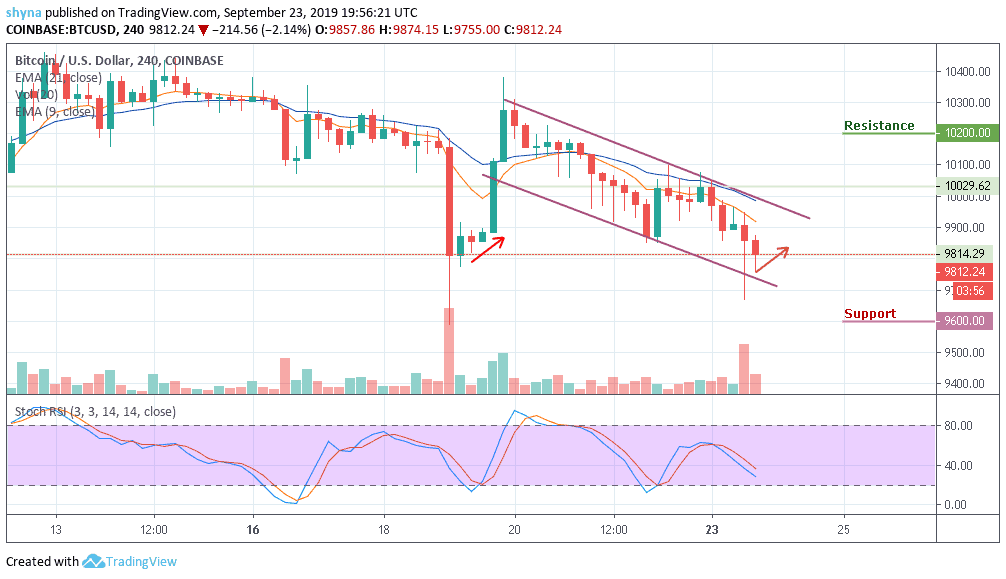
Now, the price is facing the $9,700 important support. Once this support breaks, the $9,600 and below may come into play. More so, the Stochastic RSI moves below level 40, which show more bearish momentum may likely play out.
Please note: Insidebitcoins.com is not a financial advisor. Do your research before investing your funds in any financial asset or presented product or event. We are not responsible for your investing results.
Join Our Telegram channel to stay up to date on breaking news coverage