Join Our Telegram channel to stay up to date on breaking news coverage
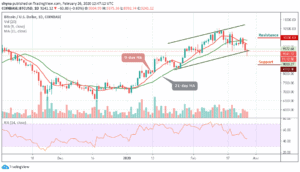
Bitcoin (BTC) Price Prediction – February 26
Today, the Bitcoin price is down from $9,310 to $8,984 as no quick recovery seems possible for the coin.
BTC/USD Long-term Trend: Bullish (Daily Chart)
Key levels:
Resistance Levels: $10,000, $10,200, $10,400
Support Levels: $8,500, $8,300, $8,100
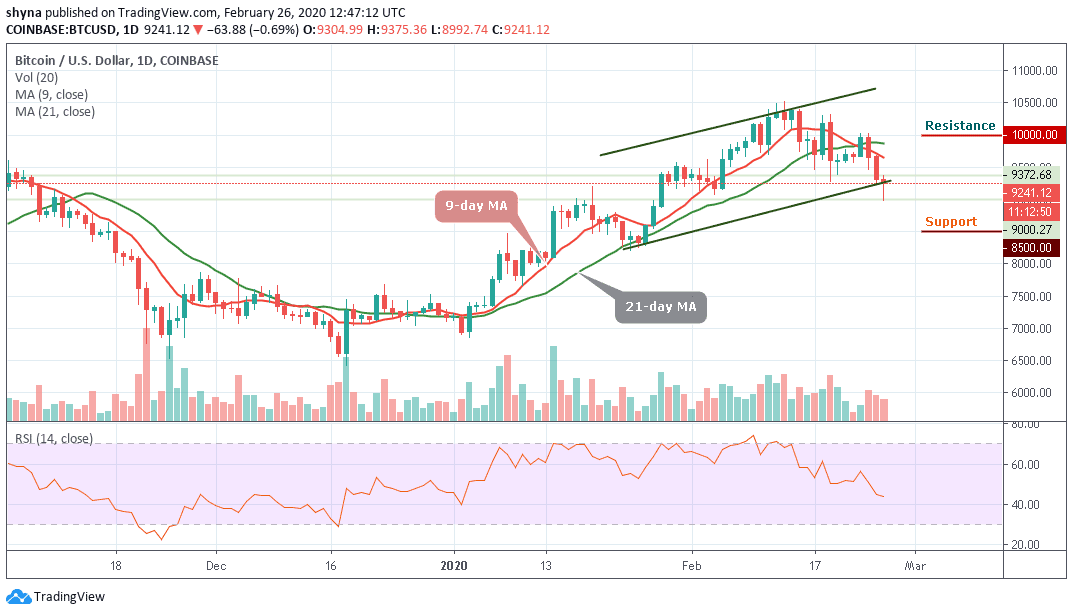
On the daily BTC/USD chart, we can see that price levels have rapidly declined to result in Bitcoin dropping over $800 within the space of a few days. Since then, short-term price action has formed a wedge that has clearly broken to the downside. This has resulted in price levels moving to the south. Buying volume has yet to flood back into the market and will be required in order to sustain any form of a new uptrend.
However, Bitcoin is facing a setback for now; this is not a permanent one. The coin is likely to have a bullish run in the short-term but a price rally may help the coin to touch its monthly high. Currently, Bitcoin is trading around $9,241 level after a free fall from $10,024 a few days back. The coin has shown tremendous volatility over the past few days.
Meanwhile, looking at the daily chart, $8,500, $8,300 and $8,100 serves as the major support levels, making room for BTC to fall even further. The technical indicator RSI (14) for the coin is still following the downward trend as the signal moves to touch 40-level. BTC/USD may see resistance levels at $10,000, $10,200 and $10,400.
BTC/USD Medium – Term Trend: Bearish (4H Chart)
Looking at the 4-hour chart, the bears have been dominating the market tremendously and the bulls couldn’t defend the $9,000 support. Meanwhile, the $8,700 and below may come into play if BTC breaks below the lower boundary of the channel.
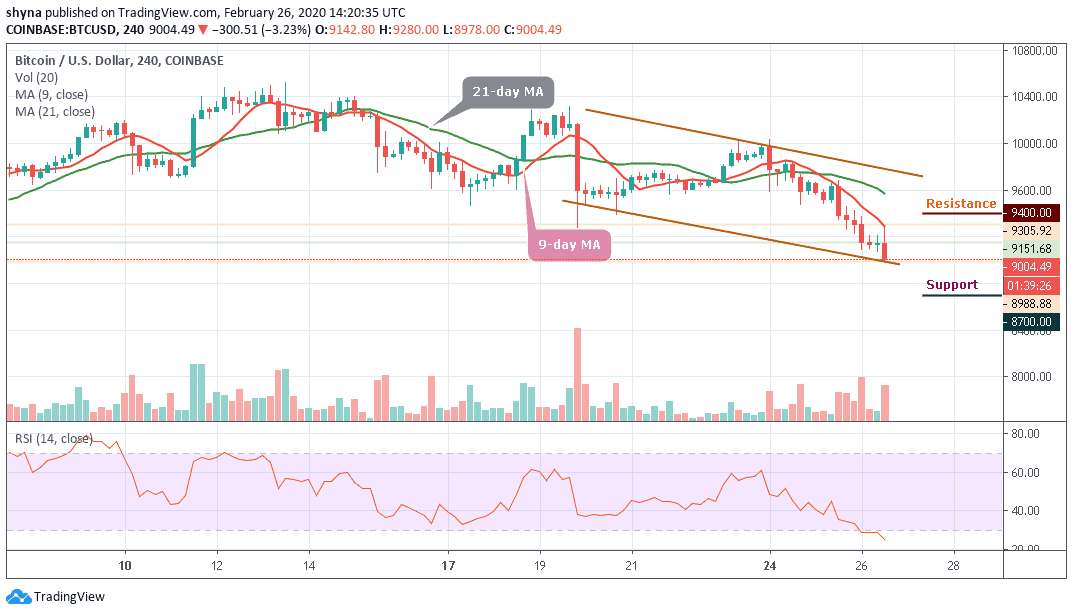
In addition, if the buyers can reinforce and power the market, traders may expect a retest at $9,200 resistance level and breaking this level may further allow the bulls to reach $9,400 and above. The RSI (14) is entering into the oversold zone, indicating more bearish signals.
Please note: Insidebitcoins.com is not a financial advisor. Do your research before investing your funds in any financial asset or presented product or event. We are not responsible for your investing results.
Join Our Telegram channel to stay up to date on breaking news coverage