Join Our Telegram channel to stay up to date on breaking news coverage
BCH Price Prediction – November 23
Bitcoin Cash (BCH) resumed downward trends after hitting $305 a few weeks ago. The coin is driven by the bearish sentiments that dominate the market.
BCH/USD Market
Key Levels:
Resistance levels: $240, $260, $280
Support levels: $180, $160, $140

The price of Binance Cash (BCH) is currently disappointing for many traders. The coin started the downtrend a few weeks ago and still has not recovered. The BCH/USD price is trading below the moving averages of 9-day and 21-day while the price chart is immersed in red color. More so, there does not seem to be any sign of improvement with the intraday price movement which encourages traders to rethink their investment option.
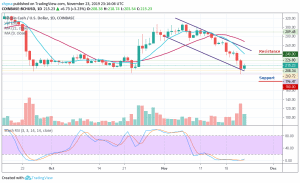
Moreover, the Bitcoin Cash has continued to drop further lower until finding support at the expected level of $204.38. During yesterday’s trading, we can see that BCH/USD even spiked lower into support at $196.47 breaking the lower boundary of the channel. If the sellers start to push the market further lower once again, bears can expect immediate support to be located at $195 level.
However, up till yesterday, the BCH/USD pair opened the market with $226.80 and closed at $208.34. Today, the price took a steep walk from $208.34 to where it is trading currently at $215.23 by 3.23%. The significant resistance levels are $240, $260 and $280 but if the price experiences a break below the $190 support level, it could cause a bearish wave and beneath this, further supports could be found at $180, $160 and $140 levels respectively.
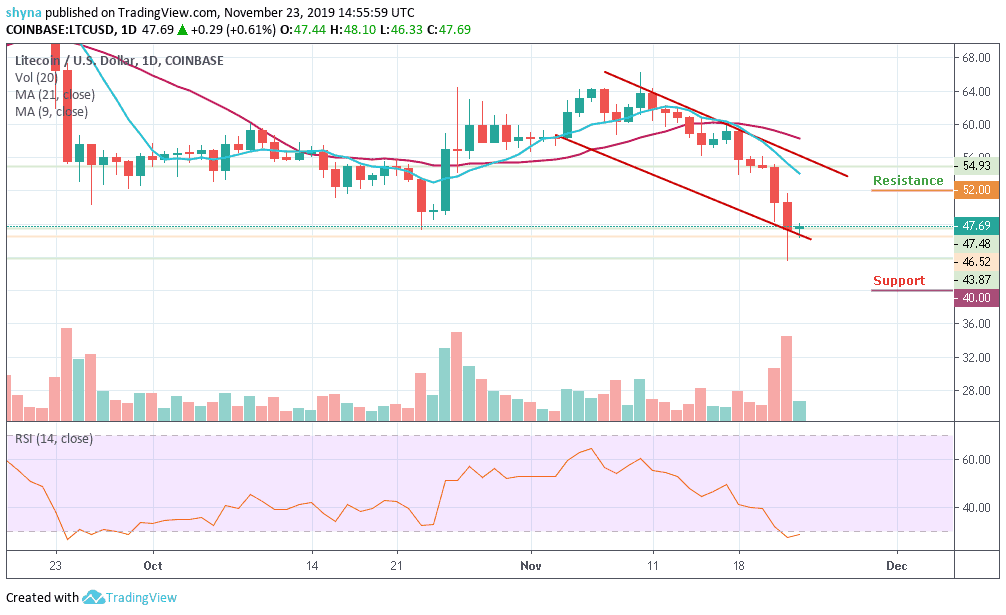
The Stochastic RSI for BCH is already in the oversold zone; possible buying pressure is likely if it turns upward.
Against Bitcoin, the BCH price has been decreasing since November 13. How long will this decrease continue? The BCH price is trading towards the 9-day moving average within the descending channel. The long-term moving average is very close to making a bullish cross. The price may likely make a head and shoulders pattern.
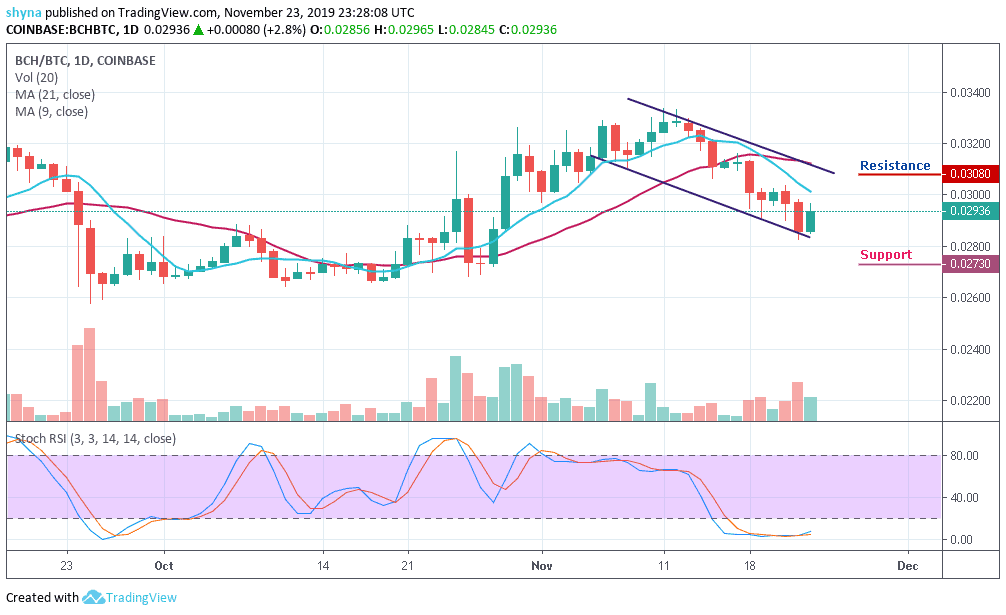
From above, if the buyers can move the price above 3000 SAT, higher resistance lies at 3080 SAT and 3180 SAT. Moreover, should the bulls fail to move it above the aforementioned levels, then, the nearest level of support toward the downside lies at 2730 SAT and 2630 SAT while the RSI (14) moves above the level 40, which shows that the buyers may likely step back into the market.
Please note: Insidebitcoins.com is not a financial advisor. Do your research before investing your funds in any financial asset or presented product or event. We are not responsible for your investing results.
Join Our Telegram channel to stay up to date on breaking news coverage