Join Our Telegram channel to stay up to date on breaking news coverage
BCH Price Prediction – November 19
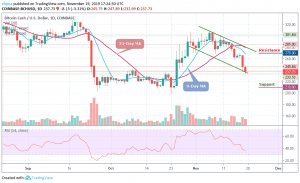
BCH coin formed a support level at $243 yesterday; currently heading towards the same. The coin traded under selling pressure; gives no signs of recovery.
BCH/USD Market
Key Levels:
Resistance levels: $270, $280, $290
Support levels: $210, $200, $190
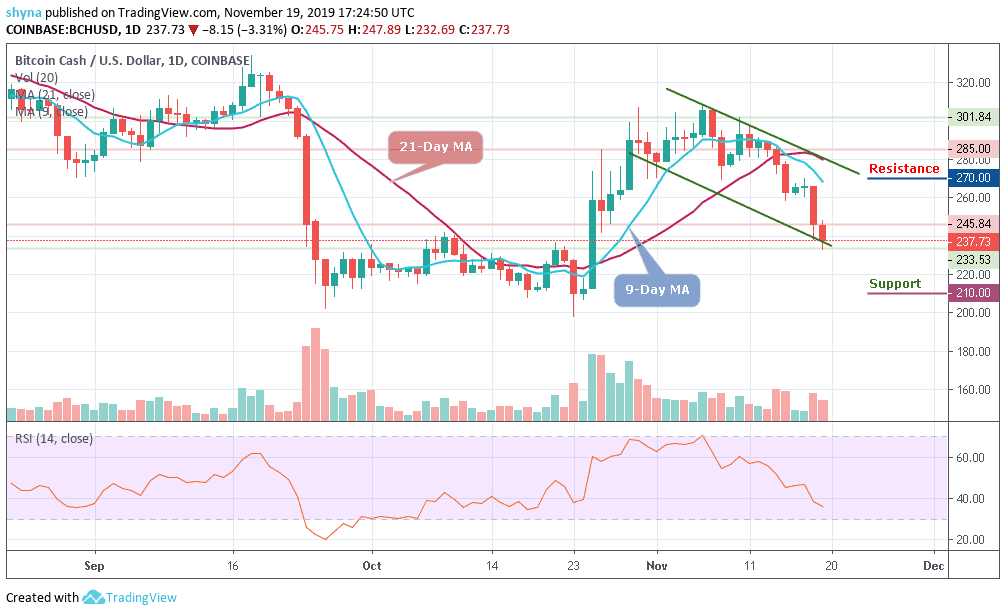
Since November 10, the highest recorded Bitcoin Cash (BCH) value was approximately $301 and the price has dropped almost suddenly in less than a month to go below the $242 level. The market broke down today, touching its lowest daily level at $233.53. The current performance of the coin in the market is below the normal expectations of traders and the coin could soon recover from these downtrends.
Moreover, as the BCH trading volume continues to favor the sellers, the bears are taking charge. For now, BCH/USD is currently facing critical support at $237 level within the descending channel. A break below this channel is likely to produce a huge red candle to the downside, marking supports at $210, $200, $190 levels and below.
Furthermore, a bullish step back is likely to roll the market back to $265 resistance with a possible above the 9-day and 21-day moving averages to $270, $280 and $290 resistance levels, establishing a new high for the market. Looking at the chart, we can see that the RSI (14) moves below the 40-level due to the decrease in price. A precise bull cross might reveal a buy signal for the market.
Comparing with Bitcoin, BCH performance has been very low due to a recurring bearish sentiment which has caused the market to fall drastically. As the price falls, sellers are posing an additional threat for buyers to reach the support level of 0.0291 BTC where the nearest target is located. However, an eventual break below the lower side of the descending channel may cause Bitcoin Cash to collapse.
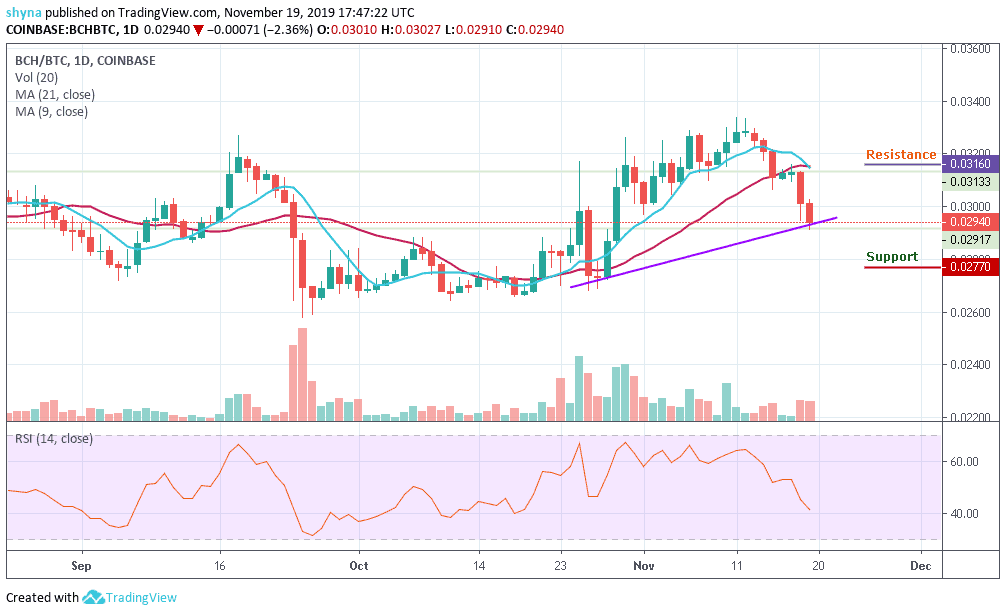
Meanwhile, for a positive upsurge, the 0.0316 BTC and 0.0356 BTC are the major resistance levels for the coin for now. Therefore, a negative spike could retest the important support at the 0.0277 BTC and 0.0270 BTC before a possible slip to 0.0260 BTC. The trading volume is fading away while the RSI (14) nosedive to level 40, indicating more bearish signals.
Please note: Insidebitcoins.com is not a financial advisor. Do your research before investing your funds in any financial asset or presented product or event. We are not responsible for your investing results.
Join Our Telegram channel to stay up to date on breaking news coverage