Join Our Telegram channel to stay up to date on breaking news coverage
BCH Price Prediction – March 4
Traders were concerns about Bitcoin Cash’s sudden dip below $340; BCH/USD may reclaim back the level before the end of the week.
BCH/USD Market
Key Levels:
Resistance levels: $400, $420, $440
Support levels: $240, $220, $200
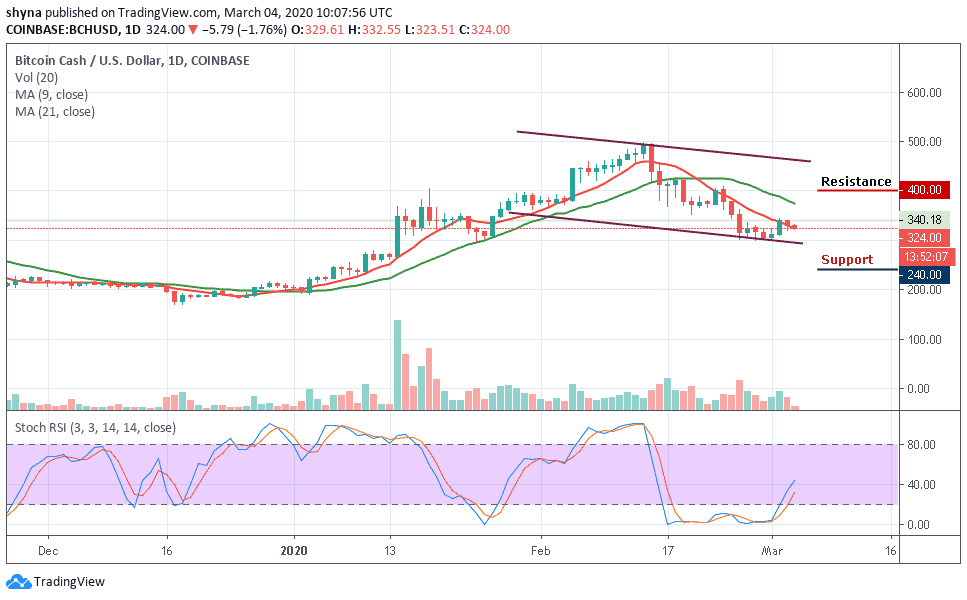
BCH/USD is currently battling with the downward pressure which continues to dominate the entire crypto landscape. A few actions were witnessed to the upside a few days ago. However, the zone between $305 and $320 stayed intact as the key support level. The bulls are keen to ensure that the price stays above $340 but yesterday’s dips into the $330’s range tested $319 support zone.
Moreover, despite the fact that the price reached as high as $344 a couple of days ago, it was unable to maintain its performance and started to recede downwards. Currently, the coin moves around the 9-day moving average but below the 21-day moving average and the present trend indicates that BCH prices may fall slightly before the day runs out.
Furthermore, if the market drives below the $270 support, BCH/USD could slump to $240, $220 and $200, bringing the price to a new monthly low. Meanwhile, if the bulls can hold the support at $320, as the stochastic RSI faces the north, a strong buying pressure may likely take the price to $360 resistance. While trading at $380, a bullish continuation could touch the $400, $420 and $440 resistance level.
Compared to Bitcoin, the daily chart reveals that traders have yet to show a strong commitment to buying on the market. Meanwhile, in as much as the bulls turn strong, we may expect the market to skyrocket to the resistance levels of 4200 SAT and 4400 SAT.
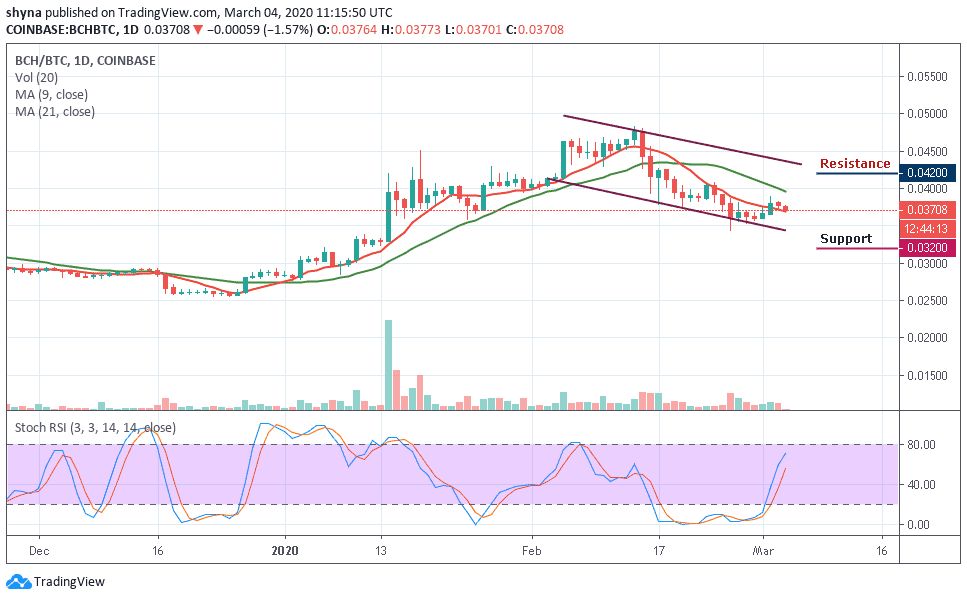
In other words, the 3200 SAT and 3000 SAT may likely produce support for the market should in case the buyers fail to push the price above the moving averages. The BCH/BTC pair may continue to follow the downward trend while the stochastic RSI signal lines are above the 50-level.
Please note: Insidebitcoins.com is not a financial advisor. Do your research before investing your funds in any financial asset or presented product or event. We are not responsible for your investing results.
Join Our Telegram channel to stay up to date on breaking news coverage