Join Our Telegram channel to stay up to date on breaking news coverage
BCH Price Prediction – May 3
BCH/USD) retreats to test $245 support ahead of the breakout to $300 and it is necessary for the next rally as long as the $245 support is not broken.
BCH/USD Market
Key Levels:
Resistance levels: $320, $340, $360
Support levels: $200, $180, $160
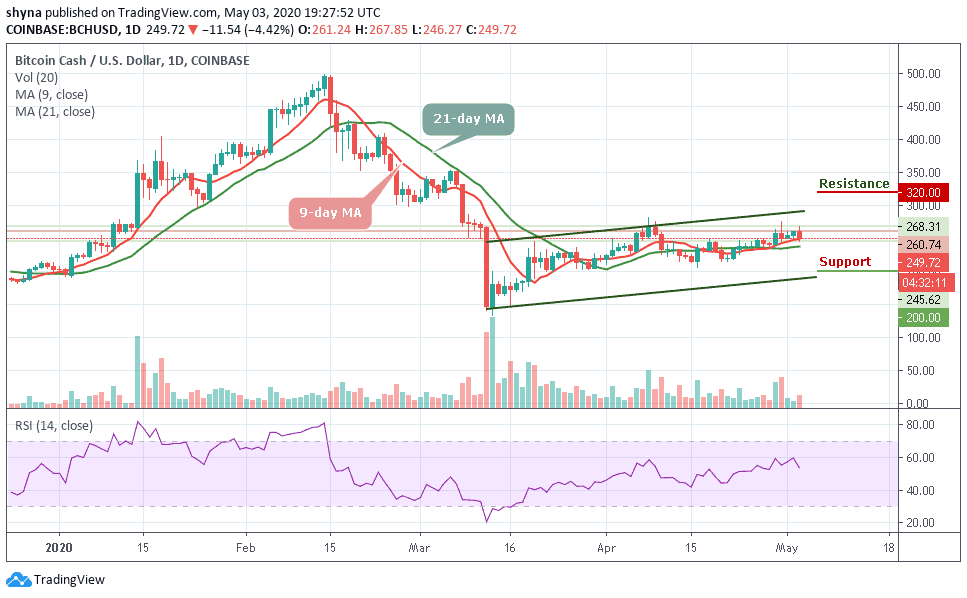
Despite maintaining a bullish movement for the past few weeks, it looks like BCH/USD is looking to slow down and settle around the $250 level. The market broke down today, touching its lowest daily level at $245.62. The current performance of the coin in the market is below the normal expectations of traders and the coin could soon recover from this downtrend.
Meanwhile, BCH/USD is currently trading at $249.72; the daily chart shows that the coin is currently trading below the 9-day moving average within the ascending channel. As at the time of writing, the market price nosedives and may likely touch the green-line of the 21-day moving average, issuing a sell signal as the RSI (14) moves toward the 54-level.
Moreover, a minimum swing may likely push the market to a $220 level of support. Exceeding this level could drag the price to the supports of $200, $180, and $160 by crossing the lower trend line of the channel. In other words, a high swing may likely take the bulls to a key resistance level of $300. Above this, the coin can possibly trigger a bullish rally which may take the price to $320, $340, and $360 resistance levels.
As revealed in the daily chart, against BTC, the bears have shown more commitment to BCH trading. Following the recent negative sign, the trend may continue to follow the downtrend if the buyers failed to push the price above the 9-day and 21-day moving averages.
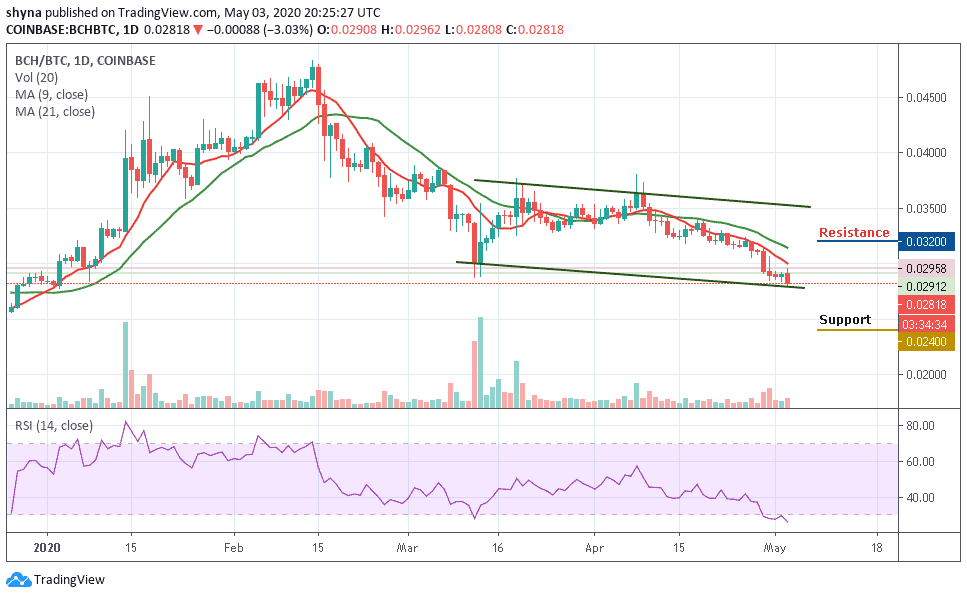
However, as the technical indicator RSI (14) is hovering within the oversold zone, once it moves out of this zone, the market price may likely resume an upward trend, which may likely cross above the moving averages to touch the resistance level of 0.032 BTC and 0.034 BTC but a cross below the lower boundary of the channel could lower the price to 0.024 BTC and 0.022 BTC support levels.
Please note: Insidebitcoins.com is not a financial advisor. Do your research before investing your funds in any financial asset or presented product or event. We are not responsible for your investing results.
Join Our Telegram channel to stay up to date on breaking news coverage