Join Our Telegram channel to stay up to date on breaking news coverage
BCH Price Prediction – March 18
Bitcoin Cash has remained range-bound with the short-term outlook ranging well within the channel.
BCH/USD Market
Key Levels:
Resistance levels: $250, $270, $290
Support levels: $120, $100, $80
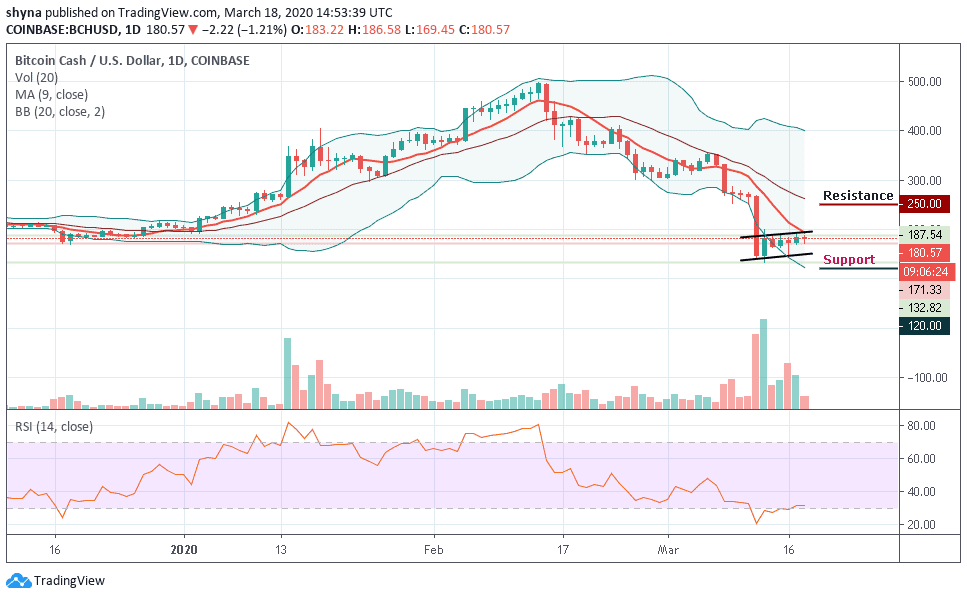
BCH/USD is in the hands of the bulls but selling activities cap movement under $200. However, due to lack of enough buying power, the bulls could not sustain higher growth leading to a retest of the broken support area at $210. The technical indicator RSI (14) points towards a domineering sideways trading action in the coming sessions. Looking back at the recent dip to $132.82, recovery has been steady but acutely limited under $200.
At the time of writing, BCH/USD is trading at $180.57. The immediate downside is protected by the lower boundary of the channel at $160. Another support has been established at $140. Besides, the range support at $130 is a key to the BCH. Other vital areas to watch include the main trend line of Bollinger bands at $120, $100 and $80 support levels. Technically, sideways trading action could dominate the current session and this may continue in the coming sessions.
Following the recent price, BCH/USD is currently facing a potential resistance at $200 level above the 9-day moving average which is across the upper boundary of the channel. A break above this channel is likely to produce a huge green candle to the upside, marking resistances at $250, $270, $290 levels and above. By then, the Bitcoin Cash market would have been in a bullish run.
Against BTC, the market bounces back a few days ago to move above the 9-day moving average. At the time of writing, BCH has not been able to push the price above the channel, but it was able to touch the 3471 SAT before the slight drop to 3358 SAT. If the Bitcoin cash signal more bullish rally, it may likely meet resistance at 4000 SAT and above.
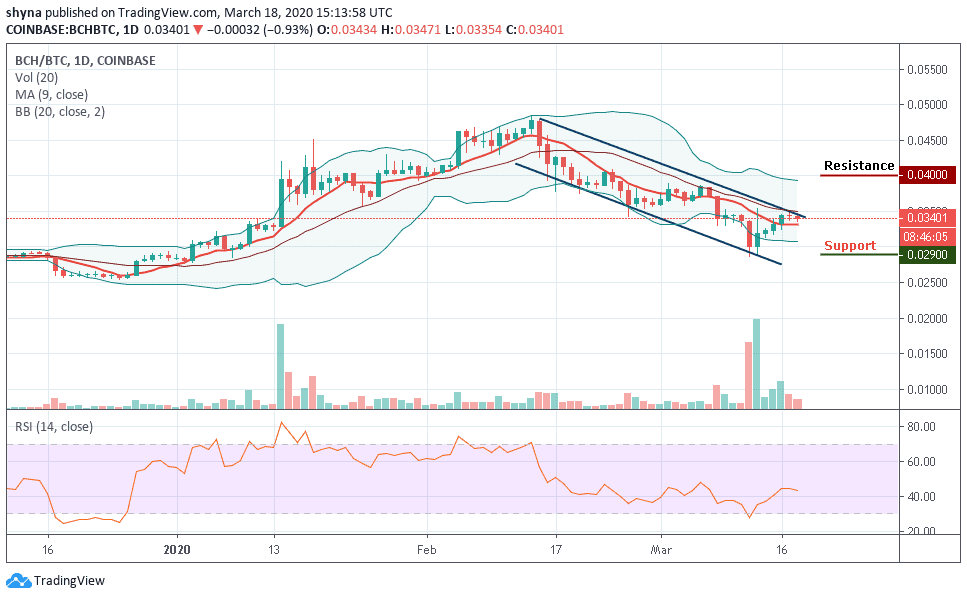
Meanwhile, looking at the daily chart, we can say that the market may soon resume into a sideways movement as the technical indicator RSI (14) moves below 45-level. More so, BCH is likely to break below the moving average where it consolidating. However, should Bitcoin Cash drops below this consolidation area, the price may find supports at 2900 SAT and beyond.
Please note: Insidebitcoins.com is not a financial advisor. Do your research before investing your funds in any financial asset or presented product or event. We are not responsible for your investing results.
Join Our Telegram channel to stay up to date on breaking news coverage