


Join Our Telegram channel to stay up to date on breaking news coverage
BCH Price Prediction – March 15
Bitcoin Cash buyers defend $165 support, which results in a shallow recovery above $180.
BCH/USD Market
Key Levels:
Resistance levels: $295, $315, $335
Support levels: $75, $55, $35
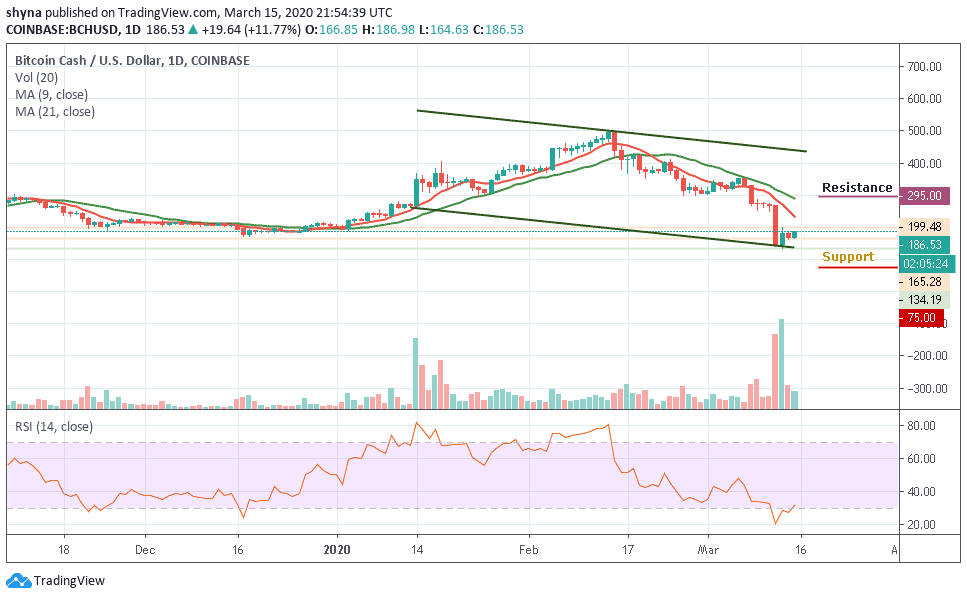
BCH/USD shifted its focus to $200 after clearing resistance at $185. A few weeks ago, the market was extremely down below the 9-day and 21-day moving averages. However, Bitcoin Cash reached $196 in a couple of days ago before plunging back to $165 yesterday. At the time of writing, Bitcoin Cash is creating a new bullish trend and trading at $186.53 within the descending channel.
On the other hand, peradventure the market drives below the $120 support, the BCH price may likely slump to the initial support at $90, which may later bring the price to its critical supports at $75, $55 and $35. But presently, the signal line of RSI (14) faces the north and this could increase the buying pressure as the price may cross above the moving averages to reach the $280 resistance. While trading at $280, a bullish continuation could touch the resistance levels of $295, $315 and $335.
In other words, over the past few weeks, the Bitcoin Cash price range has continued to support the market, against selling pressure. However, if Bitcoin Cash returns to the old support and break-even, bears could take over the market. But as it stands, the bulls are coming up. Therefore, traders can always expect a bullish chase before another reversal occurs
Meanwhile, against BTC, the daily chart reveals that the bulls are showing a great commitment to BCH trading. Therefore, they are following the recent positive sign that started 2days ago; the trend may continue to go up if the buyers can sustain the pressure further. However, if the bulls succeeded in breaking above the 9-day and 21-day moving averages, the market price may reach the next resistance level of 0.038 BTC and 0.040 BTC.
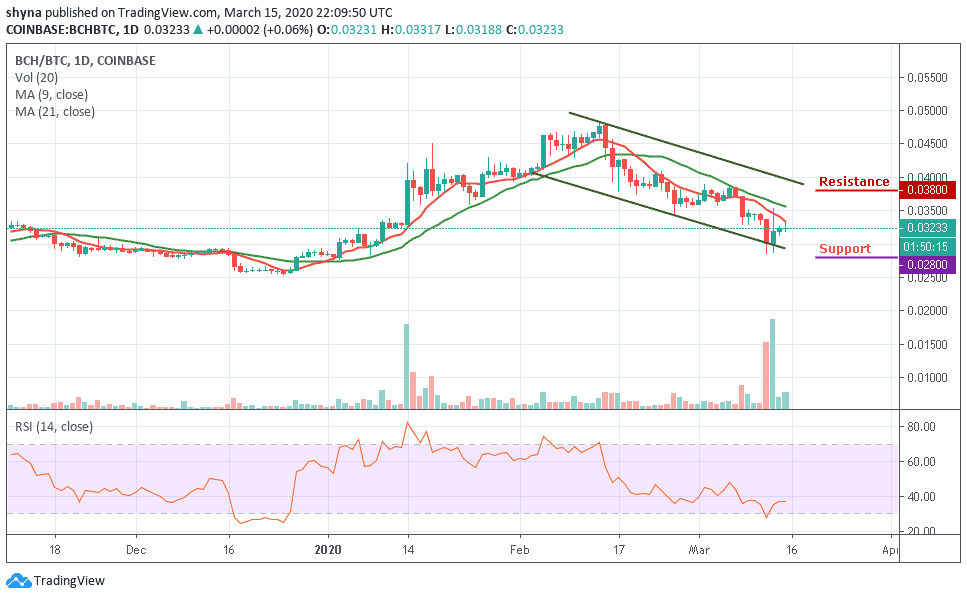
In other words, a retest could allow the pair to go below the lower boundary of the channel and lower the price to 0.028 BTC and 0.026 BTC support levels. With the look of things, the RSI (14) is moving towards the 40-level which could boost the bullish movement.
Please note: Insidebitcoins.com is not a financial advisor. Do your research before investing your funds in any financial asset or presented product or event. We are not responsible for your investing results.
Join Our Telegram channel to stay up to date on breaking news coverage
