Join Our Telegram channel to stay up to date on breaking news coverage
BCH Price Prediction – December 9
For the past few days of price actions, BCH/USD is consolidating at the lower boundary of the channel.
BCH/USD Market
Key Levels:
Resistance levels: $230, $240, $250
Support levels: $195, $185, $175
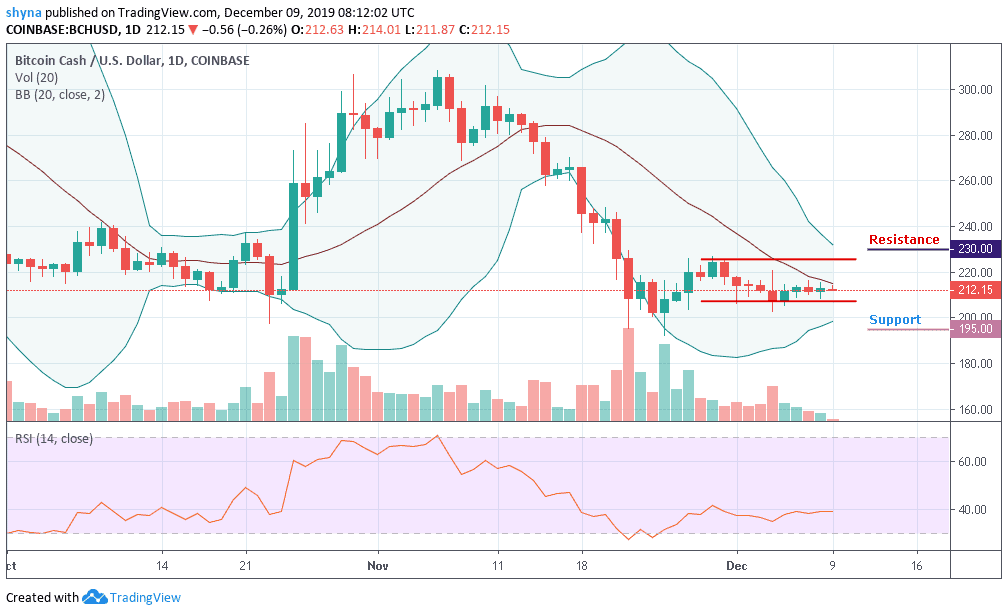
BCH/USD bulls have been fighting to come out of the valley they were pushed into during last month’s declines. Another fall in the price, which started yesterday early this month, is spotted on today’s chart too. From the past few days, the market is forming a pattern where the day begins with either having an uptrend or downtrend, but towards the end, it reverses.
Moreover, mere looking at the daily chart, BCH/USD price has continued to consolidate itself in a flag formation, waiting for a potential breakout. The daily breakdown shows us that BCH/USD had dropped to $212.15 which is around the middle boundary of the Bollinger bands after moving to $214.20 level. If the support gets weak, a price break-down may occur as the bears may find new monthly lows at $195, $185 and $175 support levels.
Furthermore, a bullish step back may likely roll the market back to $230 resistance with a possible break out of the channel and move towards the $240 and $250 resistance levels, establishing a new monthly high for the market. At the moment, the RSI (14) indicator moves in the same direction below 40, indicating an indecisive movement.
Comparing with Bitcoin, as revealed in the daily chart, the bears have shown a little commitment to BCH trading. Following the recent negative sign, the trend may continue to go down if the sellers could continue to pump more pressure into the market.
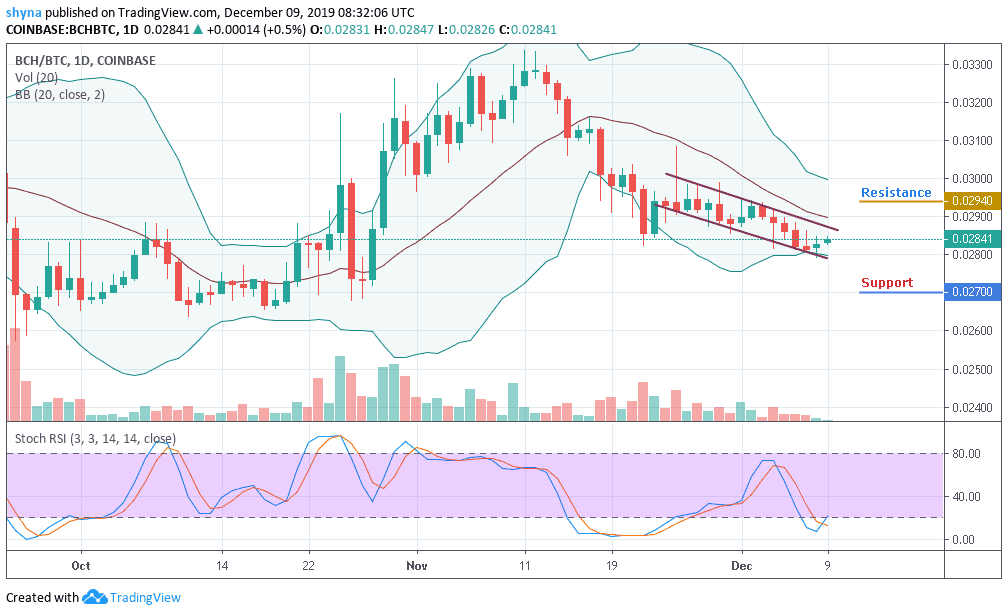
More so, if the buyers can hold the support of 0.0284 BTC, the market price may likely resume an upward trend and cross the middle boundary of the Bollinger bands to touch the resistance level of 0.0294 BTC and 0.0300 BTC but a retest could lower the price to 0.0270 BTC and 0.0260 BTC support levels but the stochastic RSI is creeping out of the oversold condition.
Please note: Insidebitcoins.com is not a financial advisor. Do your research before investing your funds in any financial asset or presented product or event. We are not responsible for your investing results.
Join Our Telegram channel to stay up to date on breaking news coverage