Join Our Telegram channel to stay up to date on breaking news coverage
BCH Price Analysis – March 31
The daily chart reveals that the Bitcoin Cash seems to be caught between the bull and the bear as the price of the cryptocurrency fluctuates in sideways.
BCH/USD Market
Key Levels:
Resistance levels: $275, $295, $315
Support levels: $155, $135, $115
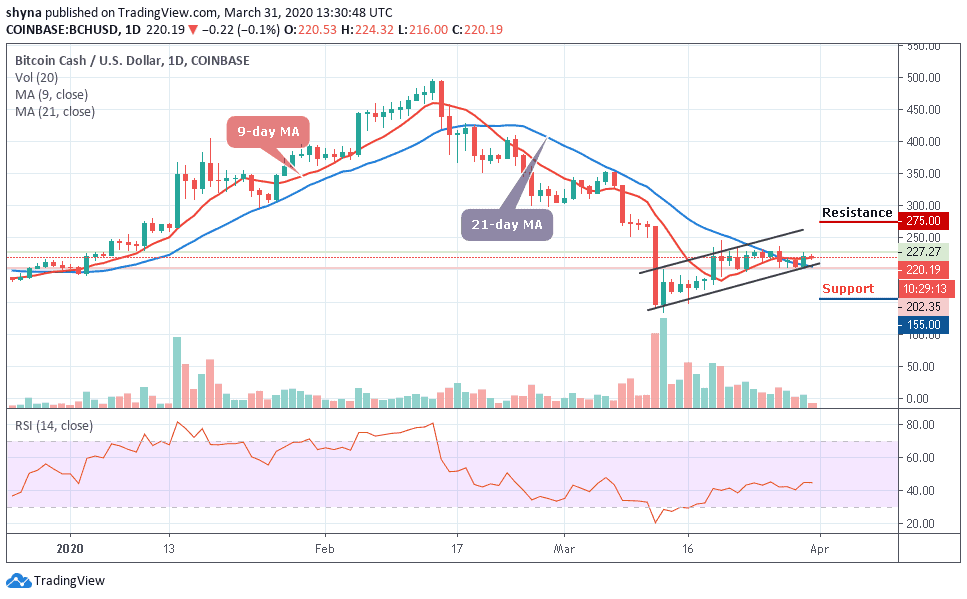
BCH/USD has been showing an uneven movement with several falls more than rises and it has not been able to maintain a consistent bullish run. More so, BCH/USD may continue to show some signs of a downward movement slowly till the latter part of the day. Meanwhile, for the past few days, the market has been forming a pattern where the day begins with either having an uptrend or downtrend, but towards the end, it reverses.
Looking at the daily chart, BCH/USD price has continued to consolidate itself in a flag formation, waiting for a cross below the 9-day and 21-day moving averages. More so, the daily breakdown reveals that BCH/USD dropped to $216 at the opening of the market today after which it corrected itself to where it is trading currently at $220 level. If the support gets weak, a price break-down may occur as the bears may find new weekly lows at $155, $135 and $115 support levels.
Nevertheless, a bullish step back may likely roll back the market to $275 resistance with a possible break out of the channel and could move towards the $295 and $315 resistance levels, establishing a new weekly high for the market. At the moment, the RSI (14) indicator has been moving in the same direction around 45-level.
BCH/BTC Market
Against BTC, the recent sideways movement is due to price stability which shows that the resistance-support is at equilibrium. Another thing to note here is that the market is preparing to change the trend and a short-term bearish breakout is most likely to play out because the technical indicator RSI (14) moves below 47-level and this could find the nearest support levels at 0.031 BTC and below.
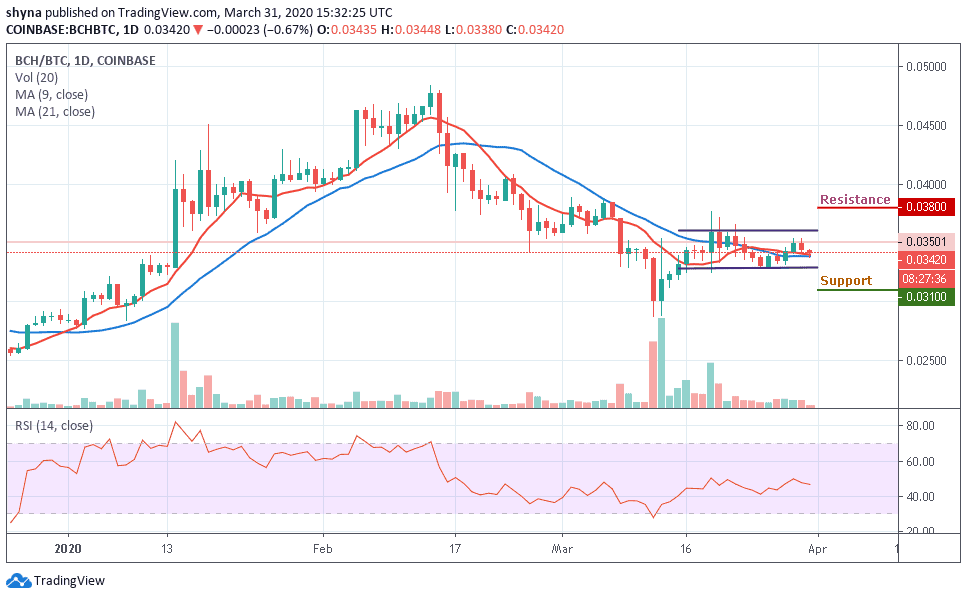
However, the only condition for the resumption of the bullish trend is if the 0.033 BTC level can continue to provide support for the market, then the price may be pushed to the resistance level of 0.038 BTC and above. Meanwhile, the BCH/BTC pair continues to remain in sideways movement hovering above the moving averages.
Please note: Insidebitcoins.com is not a financial advisor. Do your research before investing your funds in any financial asset or presented product or event. We are not responsible for your investing results.
Join Our Telegram channel to stay up to date on breaking news coverage