Join Our Telegram channel to stay up to date on breaking news coverage
BCH Market Valuation Hovers at $600– August 24
The BCH/USD price trades around $653 as the market valuation hovers around $600. The crypto’s rate of trading is at about -1.70 percent as of writing today.
Market Valuation Hovers at $600: BCH Market
Key Levels:
Resistance levels: $700, $900, $1,100
Support levels: $500, $400, $300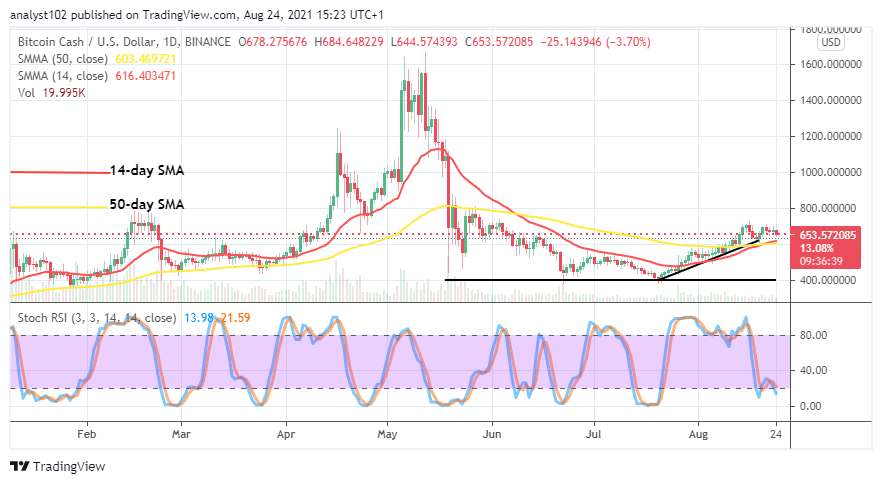
BCH/USD – Daily Chart
The BCH/USD daily trading chart showcases that the BCH/USD market valuation hovers around the level of $600 as it features variant smaller candlesticks a bit above the value. The bullish trend-line remains drawn northward alongside the 14-day SMA indicator to touch the 50-day SMA indicator underneath. And, they are close to the point mentioned earlier. The Stochastic Oscillators have moved southbound, trying to cross the lines in an extending manner to the downside. That indicates that the US fiat currency is exerting pressure on crypto presently.
As the BCH/USD market valuation hovers at $600, what could be the next price direction?
Presently, from an indication, the BCH/USD market valuation hovers around $600 tends to end up going bearish on a lighter note. The downward pressure may not be intense as the crypto market has already not seen a significant increase over some trading days’ sessions. Therefore, it would be necessary that a line of price downswings feature before a hike takes over after bulls might have found support.
On the downside, some pressures needed to exert against the line of $600 by the BCH/USD market bears. However, the downward force that could eventually come up in the market operations as indicated by the readings of the Stochastic Oscillators appears not that healthy to suffice a reliable bearish trend extension afterward. In other words, the presumed downward movement may short-live.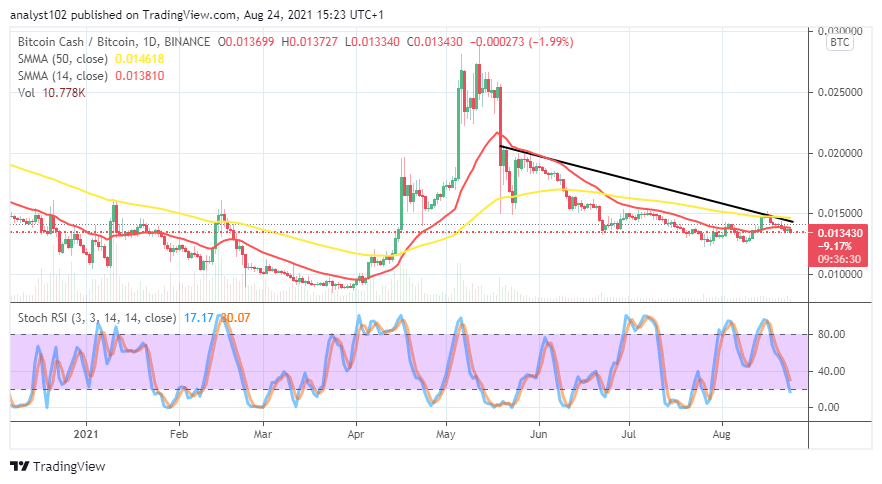
BCH/BTC Price Analysis
The BCH/BTC price analysis chart shows that the duo-crypto pair’s market valuation hovers much around the smaller SMA trend-line. The 50-day SMA indicator is a bit above the 14-day SMA indicator. The bearish trend-line drew downward to touch the bigger SMA on the buy signal side. A line of smaller candlesticks formed under the 50-day SMA trend-line shows that the base crypto’s trending weight is still undersized comparing with that of the flagship counter crypto until the present.
Looking to buy or trade Bitcoin Cash (BCH) now? Invest at eToro!
75% of retail investor accounts lose money when trading CFDs with this provider.
Join Our Telegram channel to stay up to date on breaking news coverage