Join Our Telegram channel to stay up to date on breaking news coverage
Bitcoin Cash Price Prediction – December 19
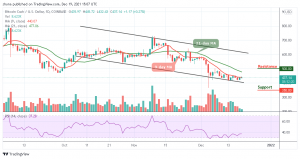
The Bitcoin Cash price is recovering from the daily low of $432 level as the price remains within the short-term bullish trend.
BCH/USD Market
Key Levels:
Resistance levels: $500, $550, $600
Support levels: $350, $300, $250
BCH/USD is recovering from the intraday low of $432 to hit the daily high at $445 level. At the time of writing, the Bitcoin Cash is changing hands at $437, having gained over 0.27% since the beginning of the European session. However, with latest the recovery, the digital asset is currently creating a higher low towards the 9-day moving average.
Bitcoin Cash Price Prediction: Can BCH Break Above $450?
The Bitcoin Cash price is currently moving to cross above the 9-day moving average at the price level of $437.14. However, if the bulls maintain the trend, BCH/USD may cross above the moving averages which could push the coin to the resistance levels of $500, $550, and $600. On other hand, any strong selling pressure may drag the price below the lower boundary of the channel if the bears step back into the market.
However, if the Bitcoin Cash (BCH) trades below the daily opening price of $435, a bearish continuation could bring the price to the supports of $350, $300, and $250. Meanwhile, the technical indicator Relative Strength Index (14) is seen moving below 40-level, indicating a possible sideways movement may play out.
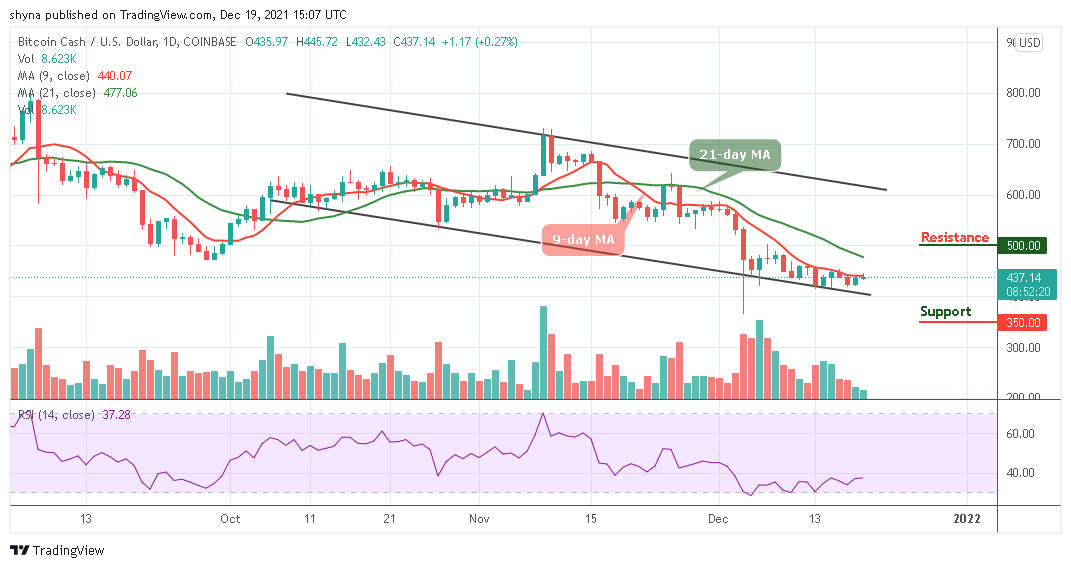
When compares with Bitcoin, the BCH trading may continue to move sideways. However, following the recent positive sign, the current market movement may remain within the 9-day and 21-day moving averages if the buyers failed to push the price above the 21-day moving average.
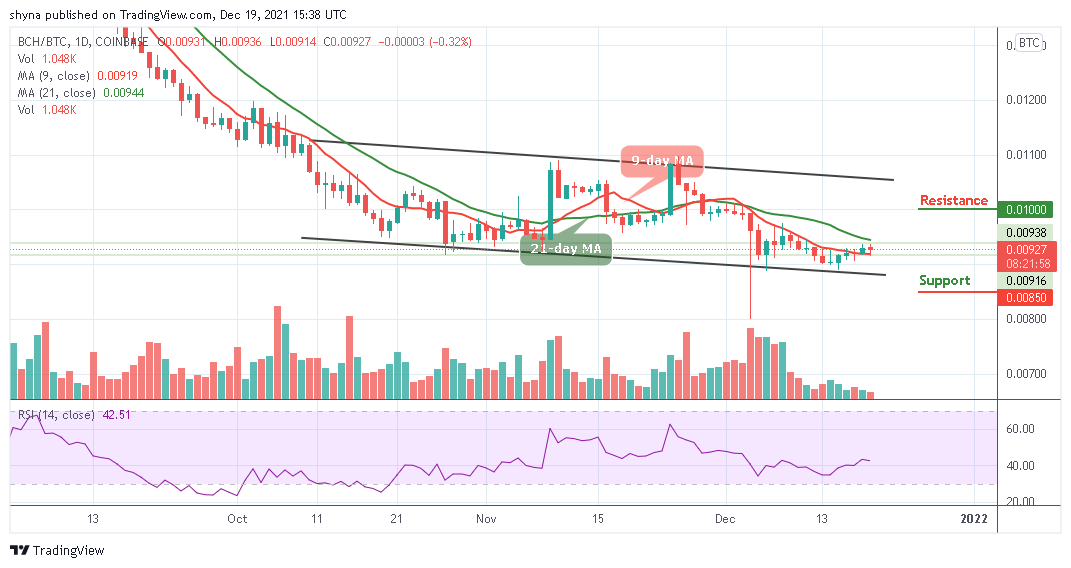
Moreover, as the technical indicator Relative Strength Index (14) is moving above 40-level, once it crosses above 45-level, the market price could resume an upward trend to touch the resistance level of 1600 SAT and above. Meanwhile, a retest below the lower boundary of the channel could lower the price to the support level of 850 SAT and below.
Looking to buy or trade Bitcoin Cash (BCH) now? Invest at eToro!
68% of retail investor accounts lose money when trading CFDs with this provider
Join Our Telegram channel to stay up to date on breaking news coverage