Join Our Telegram channel to stay up to date on breaking news coverage
BCH Price Prediction – September 27
Bitcoin Cash (BCH) slumps from $325 to $213 in the last 10 days. The price slipped under the lower curve of the 20-day Bollinger Bands.
BCH/USD Market
Key Levels:
Resistance levels: $340, $350, $360
Support levels: $160, $150, $140
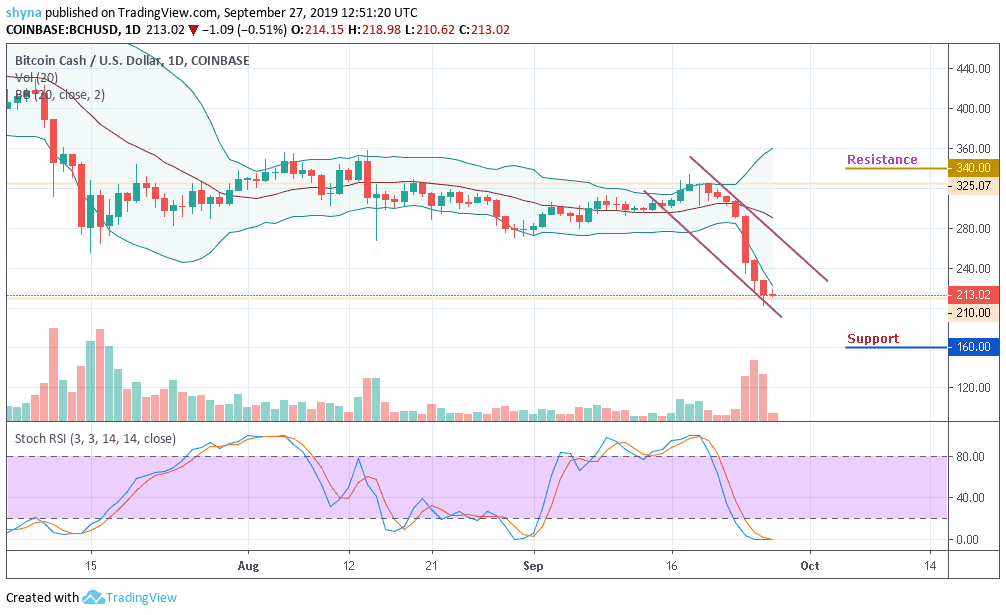
Bitcoin Cash is on the verge of a massive drop. This follows a failed attempt to break above the resistance at $325. Although $200 appears to be credible support, this time the buyers have been careful to defend the critical area. The coin has created the lowest value in the last 30 days which is $213, and the highest value is $325. It may take a few more weeks before the coin starts to climb again.
Moreover, as the BCH trading volume continues to favor the sellers, the bears are taking charge. For now, BCH/USD is currently facing critical support at $213 level within the channel at the lower boundary of the Bollinger Bands. A break below the descending channel is likely to produce a huge red candle to the downside, marking supports at $160, $150, $140 levels and below.
Furthermore, a bullish step back is likely to roll the market back to $340 resistance with a possible break out of the channel to $350, and $360 resistance levels, establishing a new high for the market. Looking at the chart, we can see that the stochastic RSI hovers around the oversold conditions due to the decrease in price. A precise bull cross might reveal a buy signal for the market.
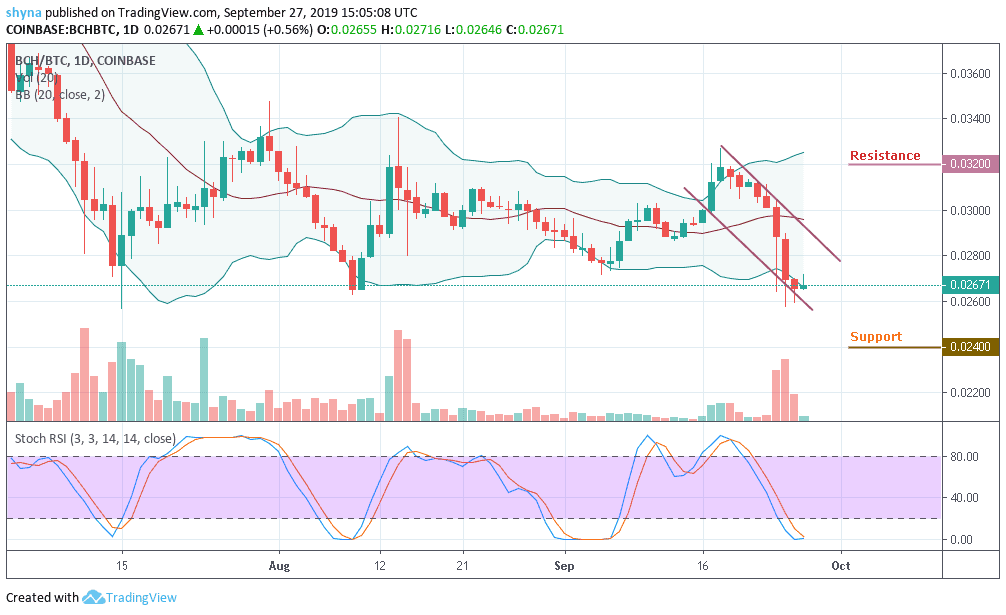
Looking at the daily chart while comparing it with BTC, we can see that traders are yet to show a strong commitment to buying. Should the buyers turn strong now, we can expect the market to roll back at the 0.032 BTC and 0.033 BTC resistance level. The 0.024 BTC and 0.023 BTC level may produce support for the market if the buyers failed to push the price to the north. Whichever way, the BCH/BTC pair continues to remain in a downward range while the stochastic RSI is extremely at the oversold territory.
Please note: Insidebitcoins.com is not a financial advisor. Do your research before investing your funds in any financial asset or presented product or event. We are not responsible for your investing results.
Join Our Telegram channel to stay up to date on breaking news coverage