Join Our Telegram channel to stay up to date on breaking news coverage
BCH Price Analysis – February 1
Bitcoin Cash is hustling to sustain the rebound; a steady uptrend above $400 is a must for the coin.
BCH/USD Market
Key Levels:
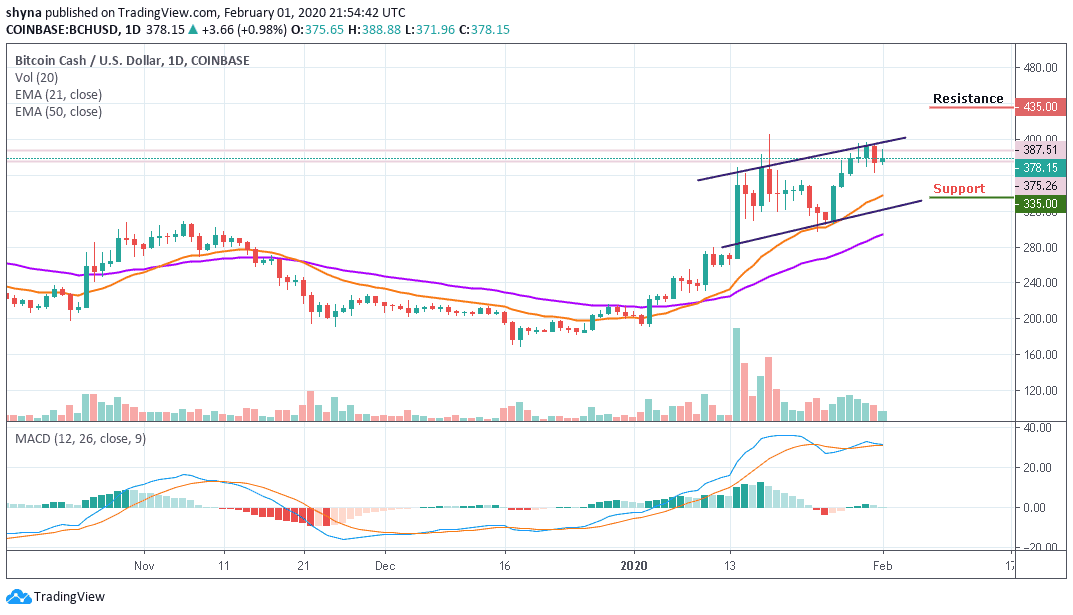
Resistance levels: $435, $445, $455
Support levels: $335, $325, $315
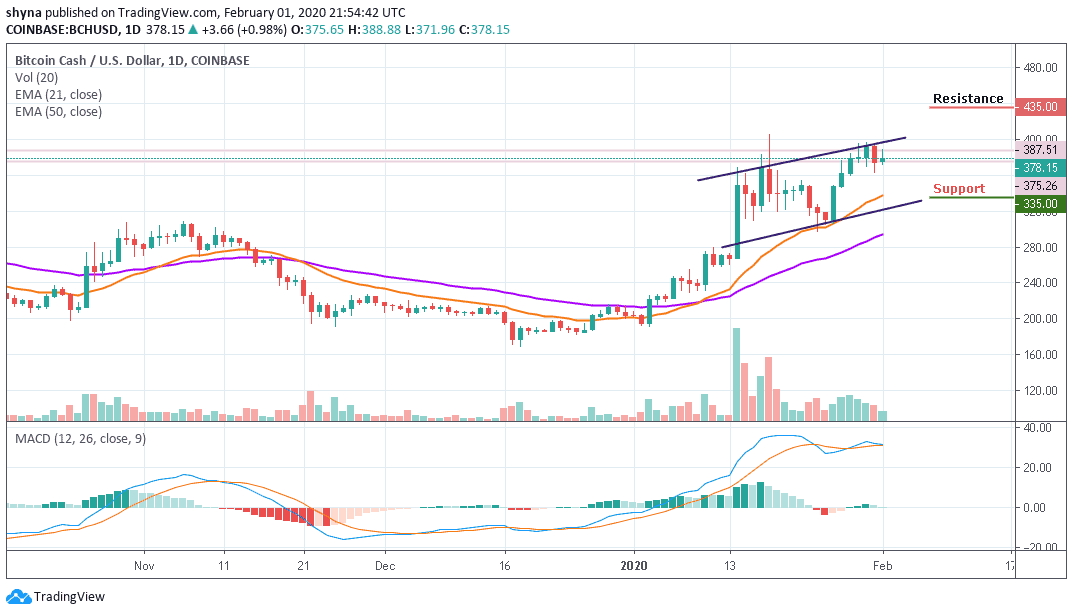
BCH/USD shifted its focus to $400 after clearing resistance at $375. A few weeks ago, the market was extremely unstable for BCH. From testing levels below $320, the crypto scaled the levels towards $370. However, Bitcoin Cash reached $370 last week before plunging back to $363 yesterday. At the time of writing, Bitcoin Cash is following a bullish trend and trading at $378 above the 21 and 50 periods EMA within the ascending channel.
On the other hand, peradventure the market drives below the $360 support, the BCH price may likely slump to the initial support at $350, which may later bring the price back to its critical supports at $335, $325 and $315. But presently, the signal lines of MACD remain within the positive side and this could increase the buying pressure as the price may break out of the ascending channel to reach the $410 resistance. While trading at $410, a bullish continuation could touch the resistance levels of $435, $445 and $455.
In other words, over the past two weeks, the BCH price range has continued to support the market, against selling pressure. However, if Bitcoin Cash returns to the old support and break-even, bears could take over the market. But as it stands, the bulls are still in charge. Therefore, traders can always expect a bullish chase before another reversal occurs.
BCH/BTC Market
Comparing with Bitcoin, the sideways movement on the daily chart is due to the price stability in Bitcoin Cash trading, which shows that the resistance-support is at equilibrium. One other thing to note is that the market is preparing to change the trend and a short-term bullish breakout may likely play out because the technical indicator RSI (14) moves above the 60-level and this could find the nearest resistance level at 0.044 BTC and above.
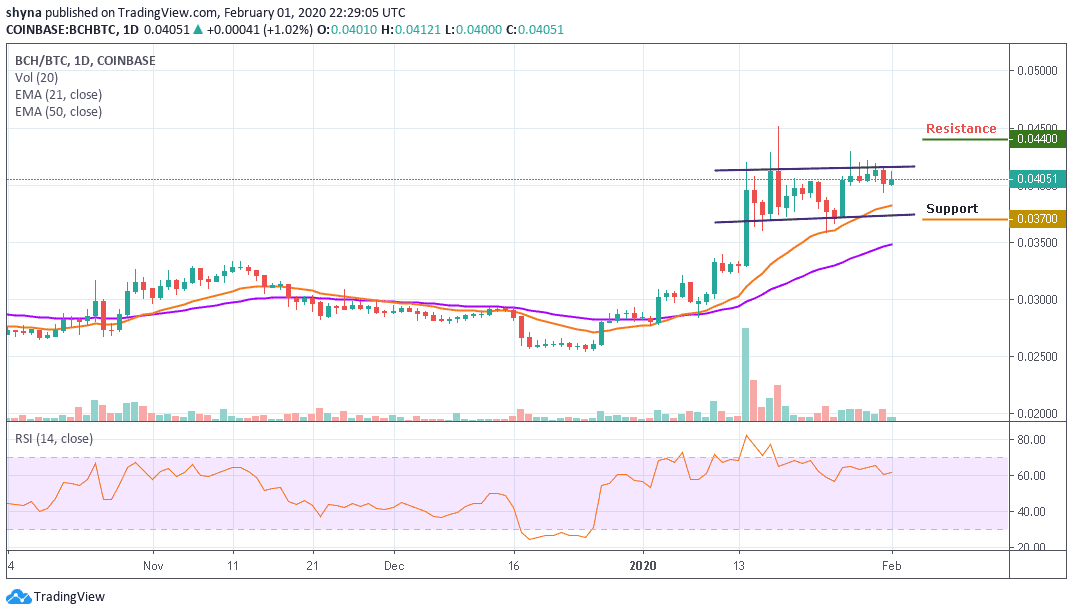
In addition, the only condition for the continuation of the bullish trend is if the 0.040 BTC level can continue to provide support for the market, else, the bears may step into the market and bring the price towards the 21 periods EMA to reach the support levels of 0.037 BTC and below. Meanwhile, the BCH/BTC pair continues to remain in a sideways movement waiting for the next direction to take.
Please note: Insidebitcoins.com is not a financial advisor. Do your research before investing your funds in any financial asset or presented product or event. We are not responsible for your investing results.
Join Our Telegram channel to stay up to date on breaking news coverage