Join Our Telegram channel to stay up to date on breaking news coverage
BCH Price Analysis – January 19
Bitcoin Cash (BCH) is likely to continue with the downward momentum as revealed by the technical indicator.
BCH/USD Market
Key Levels:
Resistance levels: $415, $425, $435
Support levels: $275, $265, $255
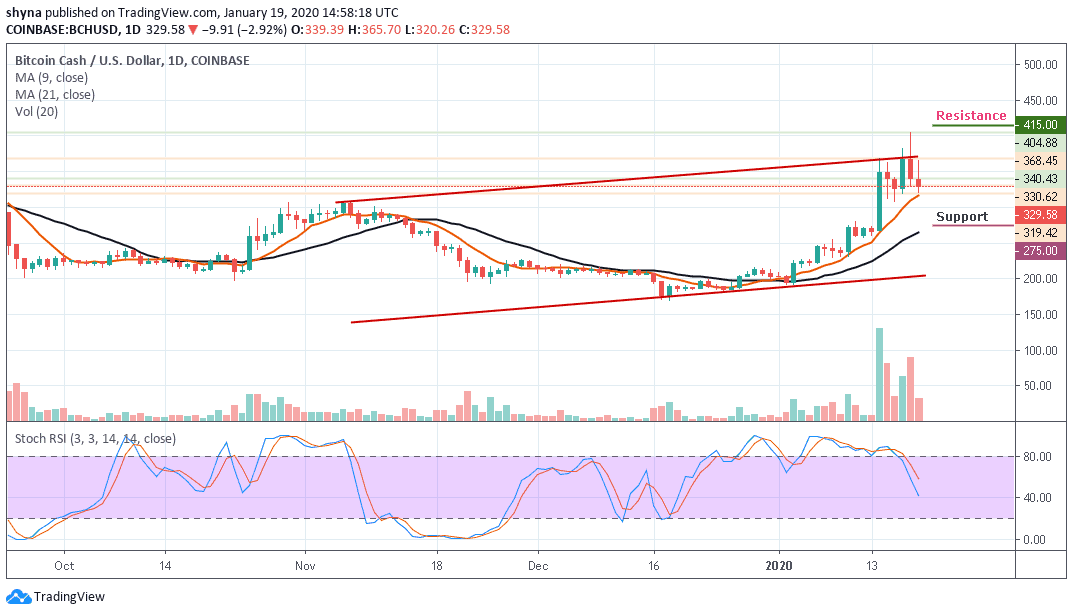
Yesterday, the BCH/USD peaked at $404.88 and has been following a downward trend within the channel. Meanwhile, for the price not staying above $404 ruins the long-term technical picture of the coin. Bitcoin cash will have to hold this ground to guide against the further downward pressure and the closest support expects the coin at $300. Once it is eliminated, the downside may likely grow, with the next goal supporting $275, $265 and $255 levels.
In addition, the Bitcoin cash is hovering at $329.58 but yet to break below the 9-day and 21-day moving averages. On the upside, a sustained move above $370 will ease the initial downside pressure and create momentum for the bulls with the focus to move the market to the next resistance levels of $415, $425 and $435 respectively. At the moment, stochastic RSI nosedives below 60-level, which indicates that the downward momentum may likely continue.
Furthermore, we realize that the recent consolidation within the descending channel was necessary for the bullish action. More so, the support formed between $225 and $230 provided air-tight protection allowing the buyers to concentrate on stirring action to the north.
BCH/BTC Market
Meanwhile, compared with Bitcoin, when looking at the daily chart, following the trade for the past few days, the bulls have shown a little commitment to BCH trading. Following the recent positive sign, the trend will continue to go up if the buyers can sustain the pressure further.
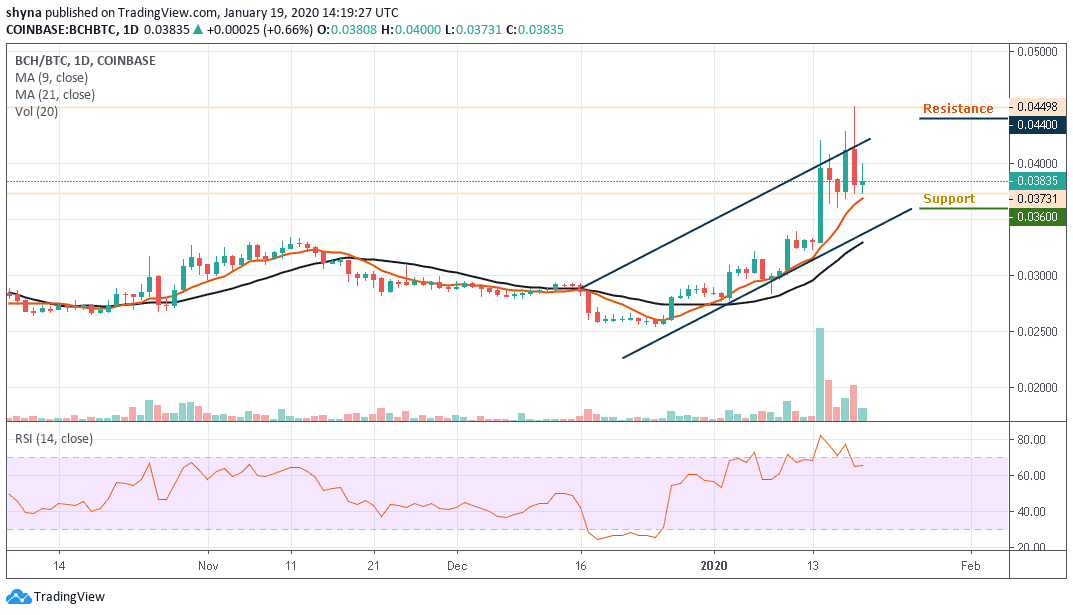
However, if the buyers succeeded in breaking the upper boundary of the channel, the market price may likely touch the next resistance level of 0.044 BTC and 0.045 BTC. In other words, a retest could lower the price to 0.036 BTC and 0.035 BTC support levels. As it stands now, the RSI (14) indicator moves around 60-level, which may allow the market to start moving in sideways.
Please note: Insidebitcoins.com is not a financial advisor. Do your research before investing your funds in any financial asset or presented product or event. We are not responsible for your investing results.
Join Our Telegram channel to stay up to date on breaking news coverage