Join Our Telegram channel to stay up to date on breaking news coverage
BCH Price Analysis – April 11
Bitcoin Cash (BCH) is likely to continue with the downward momentum as revealed by the technical indicator.
BCH/USD Market
Key Levels:
Resistance levels: $280, $300, $320
Support levels: $180, $160, $140
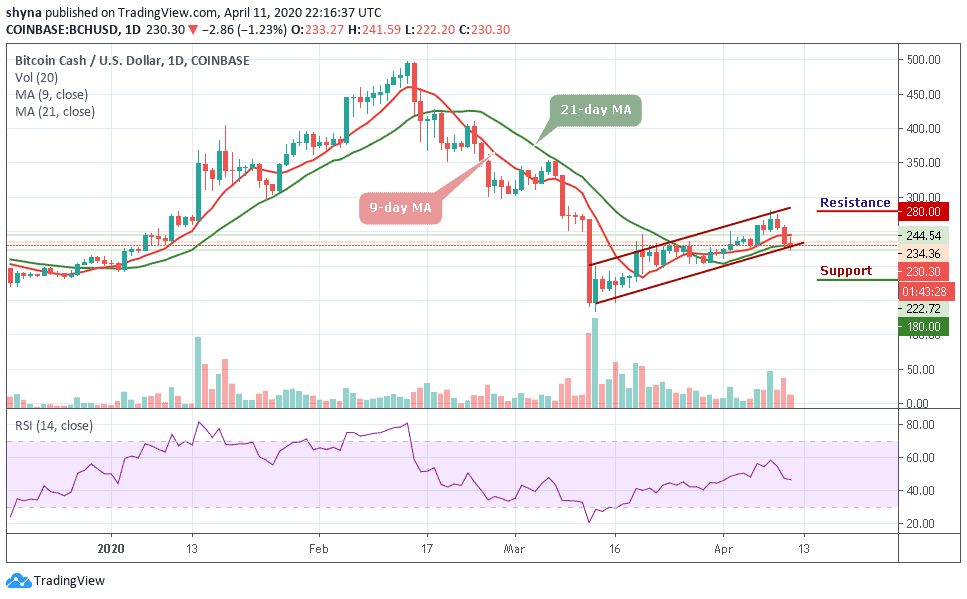
A few days ago, the BCH/USD peaked at $275 and has been following a downward trend within the channel. Meanwhile, for the price not staying above $300 ruins the long-term technical picture of the coin. Bitcoin cash will have to hold this ground to guide against the further downward pressure and the closest support expects the coin at $200. Once it is eliminated, the downside may likely grow, with the next goal supporting $180, $160 and $140 levels.
In addition, the Bitcoin cash is hovering at $230.30 but yet to break below the 21-day MA after broken the 9-day MA. On the upside, a sustained move above $260 will ease the initial downside pressure and create momentum for the bulls with the focus to move the market to the next resistance levels of $280, $300 and $320 respectively. At the moment, the RSI (14) nosedives below 50-level, which indicates that the downward momentum may likely continue.
Furthermore, we realize that the recent consolidation within the ascending channel was necessary for the bullish action. More so, the support formed between $225 and $220 provided air-tight protection allowing the buyers to concentrate on stirring action to the north.
BCH/BTC Market
When compared with Bitcoin, the daily chart reveals that the bears have started showing some commitment to BCH trading. However, following the recent negative signs, the trend may continue to go down if the sellers continue to pump more pressure into the market.
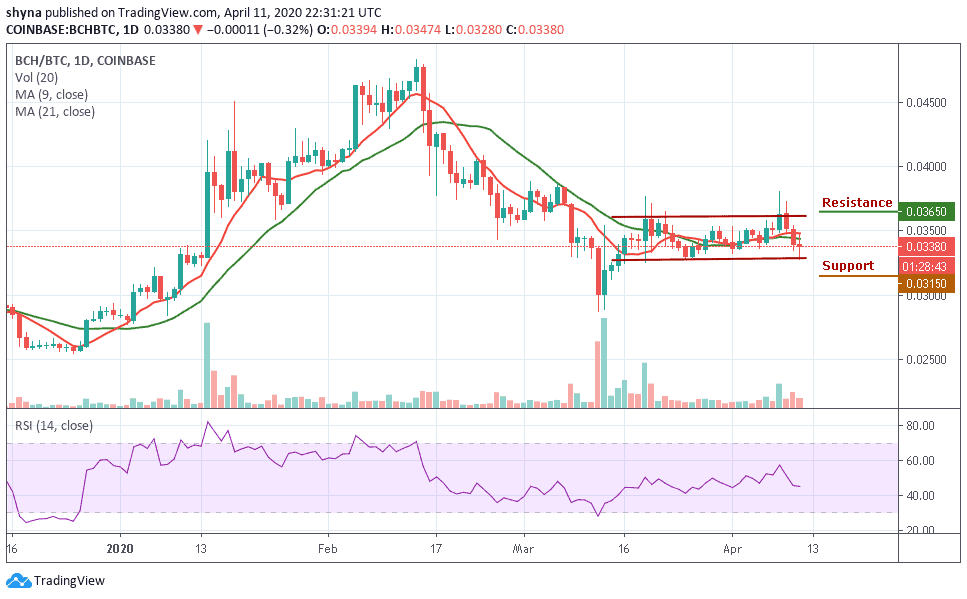
More so, as the RSI (14) signal line nosedives below 45-level, if the buyers can hold the support of 0.0338 BTC, the market price may likely continue an upward movement, while pushing further may take it to the resistance level of 0.0365 BTC and above but a retest could lower the price to the supports of 0.0315 BTC and below.
Please note: Insidebitcoins.com is not a financial advisor. Do your research before investing your funds in any financial asset or presented product or event. We are not responsible for your investing results.
Join Our Telegram channel to stay up to date on breaking news coverage