Join Our Telegram channel to stay up to date on breaking news coverage
BCH Price Analysis – August 23
If we compare the price of the BCH coin when it reached an all-time high, which was $326 on August 19th. The current price may likely give us a downtrend.
BCH/USD Market
Key Levels:
Resistance levels: $348, $358, $368
Support levels: $275, $265, $255
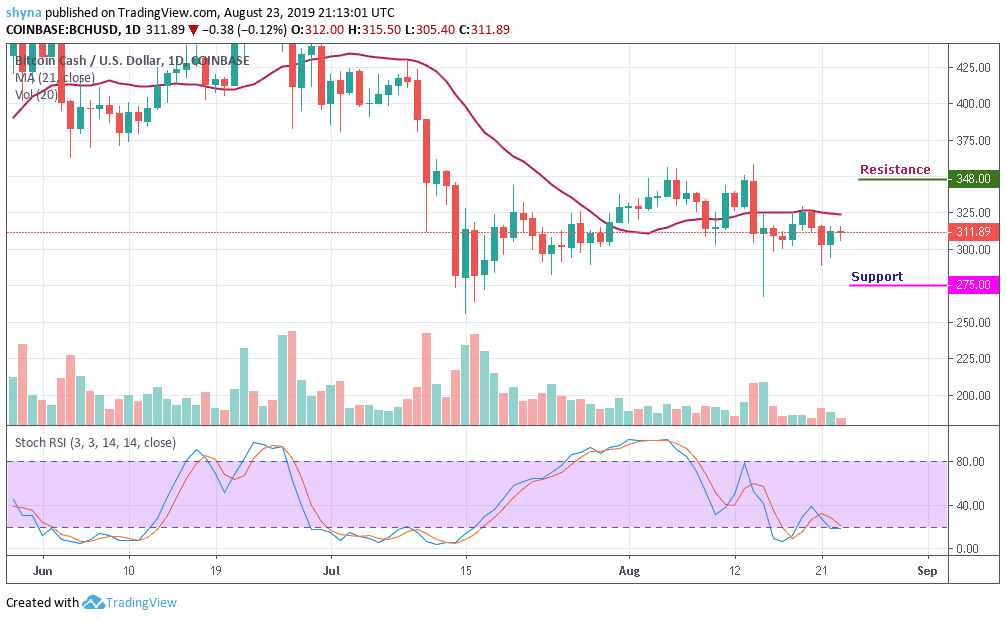
Over the past 5 days, the movement of Bitcoin Cash has been almost at the same pace without any sharp rise or fall as such. It may be traded today in the range of $306 and $313. Comparing the price of BCH since August 18, the coin was priced at $308 and the price started to show a slow and gradual rise.
Moreover, the price reached as high as $326 on August 19 but it was not able to maintain its performance and started to recede downwards. The coin later increased but the present trend indicates that BCH prices may fall marginally by tomorrow.
Furthermore, if the market drives below the $300 support, BCH price could slump to $275, $265 and $255, bringing the price to a new low. Meanwhile, a strong buying pressure may take the price to $325 resistance. While trading at $325, a bullish continuation is likely to touch the $348, $358 and $368 resistance levels as the stochastic RSI is at the oversold zone.
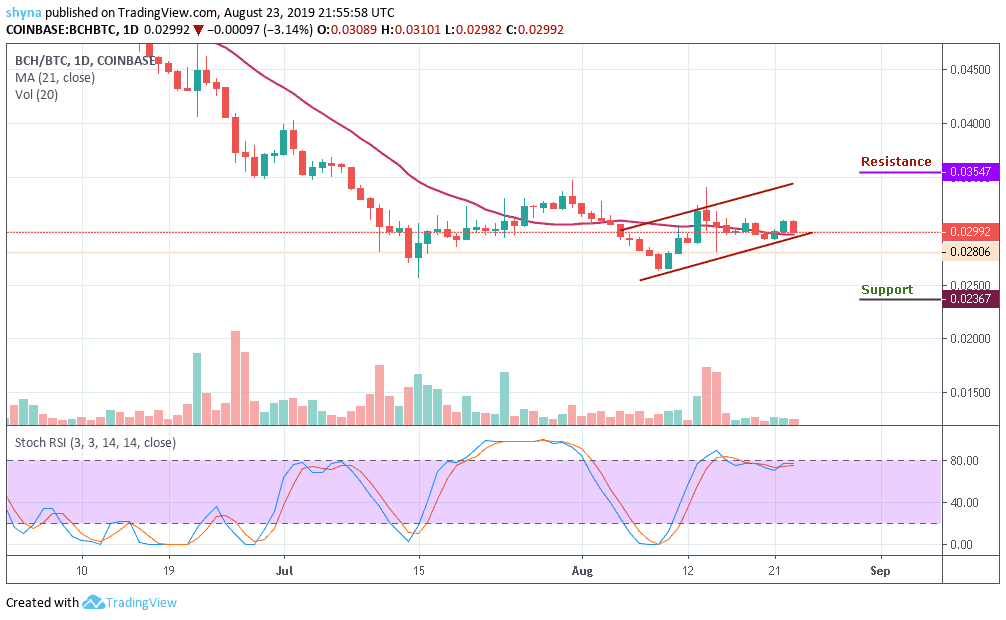
BCH/BTC Market
Against Bitcoin, the price has made an attempt to rise against Bitcoin a few days ago but as it appeared, though trading above the 21-day MA, there’s a low amount of buying pressure in the market which is why the price dropped today. BCH price is waiting for the break down below the ascending channel to touch the nearest support level of 0.027 BTC.
Meanwhile, should the bulls fail to stop the selling pressure; the price could easily fall to 0.025BTC support and the resistance to watch are 0.035BTC and above. More so, while trading at 0.025BTC support, a bearish continuation may touch the 0.023BTC and 0.021BTC respectively. Furthermore, a breach could slump the market to 0.019BTC support, creating a new low below the rising channel.
The trading volume is fading away while the Stochastic RSI is at overbought zone, indicating more bearish signals when faces downward.
Please note: insidebitcoins.com is not a financial advisor. Do your own research before investing your funds in any financial asset or presented product or event. We are not responsible for your investing results.
Join Our Telegram channel to stay up to date on breaking news coverage