Join Our Telegram channel to stay up to date on breaking news coverage
Bitcoin Price Prediction – July 1
The market valuation of BTC/USD presently responses to bearish-path resistance after it couldn’t break through the main level of $35,000 to now trade around the value of $33,563. The market’s current rate stands at a negative figure of around 3.64 percent.
BTC/USD Market
Key Levels:
Resistance levels: $37,500, $42,500, $47,500
Support levels: $30,000, $27,500, $25,000

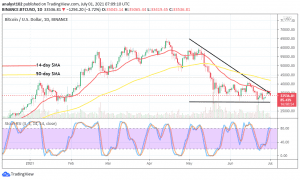
BTC/USD – Daily Chart
On the BTC/USD daily chart, a bearish candlestick forms to possibly denote a return of downward force in the crypto economy. That has led to the market’s trading situation responses to bearish-path resistance outlined alongside the bearish trend-line. The smaller SMA trend-line remains positioned near over the level of $35,000 as the bearish trend-line has placed on it downwardly. The 50-day SMA indicator is above the 14-day SMA trend-line. The Stochastic Oscillators are at a range of 80 with closed lines in an attempt to cross downward for a sell sign.
Will price push down further as the market responds to bearish-path resistance?
The BTC/USD market valuation has reached a notable resistance trading point. Therefore, bulls have relaxed their momentum as price responses to the bearish path in the market. The positioning of both the bearish trend-line and the smaller SMA on the BTC/USD daily chart has made the level of $35,000 a critical trading zone in the determination of further upward swings in the crypto’s trading space.
On the downside, the current slight downward force’s return in the market needed to be capitalized upon by the BTC/USD bears. The market’s main resistance point for a sell order is around the line of $35,000 down to the lower level of $30,000. A long-consolidation price movement around the lower value could result in letting the crypto’s worth depreciates furthermore. While that assumption is playing out, entering more sell orders is not technically worthy.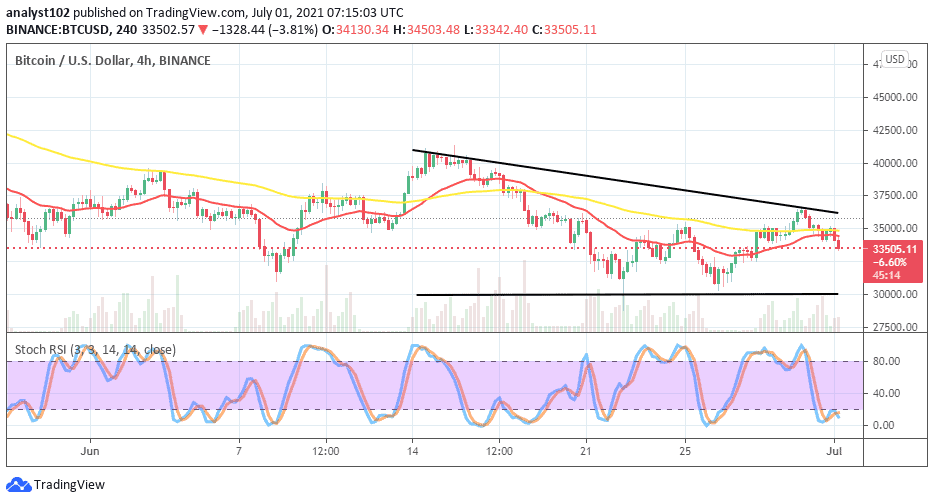
BTC/USD 4-hour Chart
There have been variant 4-hour bearish candlesticks that formed in a successive order against the trend lines of both the two SMAs on the BTC/USD medium-term chart. The 50-day SMA indicator is tightly located at the level of $35,000 as the 14-day SMA trend-line is closely underneath it. The Stochastic Oscillators are in the oversold region with crossed lines pointing southbound to indicate that a downward force is ongoing. If the force strengthens, the level of $32,500 will be breached to the south aiming for a touch of the critical support base level at $30,000 afterward.
Looking to buy or trade Bitcoin (BTC) now? Invest at eToro!
75% of retail investor accounts lose money when trading CFDs with this provide.
Join Our Telegram channel to stay up to date on breaking news coverage