Join Our Telegram channel to stay up to date on breaking news coverage
BTC/USD Builds Strength Above $61k as Bitcoin Continues Bullish Run – October 31, 2021
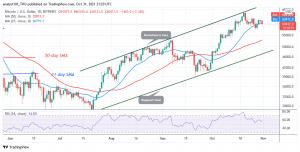
Since October 28, BTC/USD has been fluctuating above $60,000 as Bitcoin continues bullish run. At other times, the bulls buy the dips to position Bitcoin above the $60,000 support. As BTC price breaks above the moving averages, there is the tendency for a rebound. The upside momentum will resume if buyers keep prices above the $64,000 price level.
Resistance Levels: $60,000, $65,000, $70,000
Support Levels: $50,000, $45,000, $40,000
Following October 20 bearish impulse, BTC price declined but found support above the 21-day line moving average. Buyers have sustained recent rallies above the moving averages. This is a positive sign that the current uptrend is intact. Bitcoin is currently confined in a range. Buyers have an uphill task to break the resistance at $63,000 and keep the price above the $64,000 high. If the bulls are successful above resistance, the upside momentum will resume. BTC’s price will rally above the $70,000 high. The bottom line is that if the bulls fail to breach the $64,000 resistance convincingly, the BTC price will fall to the range-bound zone. Meanwhile, the bears are providing stiff resistance to the overbought regions of $63,000 and $64,000 price levels.
Bitcoin (BTC) Indicator Reading
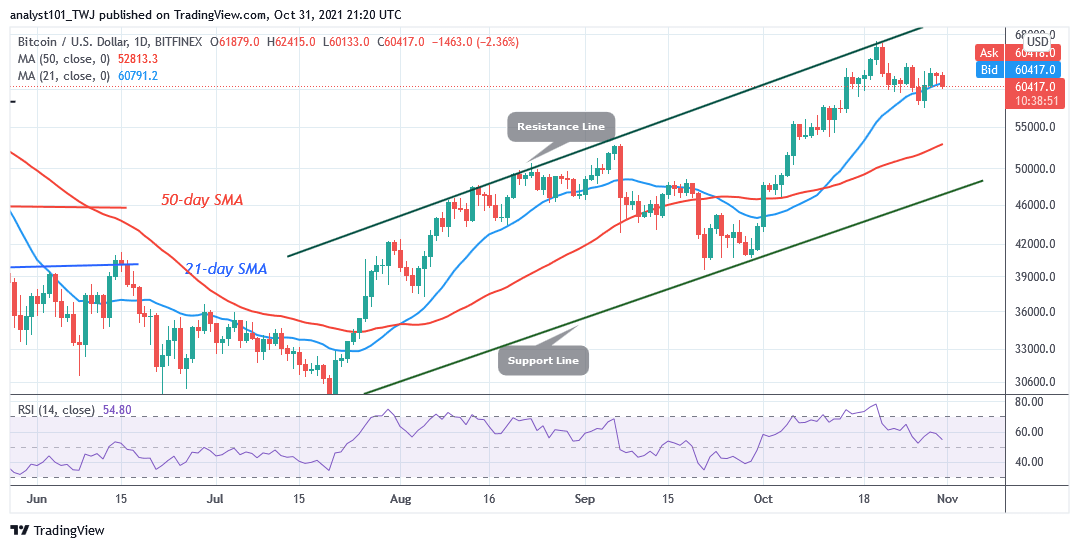
BTC price has a bullish crossover as the 21-day line SMA crosses over the 50-day line SMA. This indicates a buy signal. The 21-day line SMA provides support levels. Bitcoin is at level 54 of the Relative Strength index period 14. The crypto is trading in the bullish trend zone and above the centerline 50. The crypto is below 20% area of the daily stochastic. Buyers are expected to emerge in the oversold region to push prices upward.
Meanwhile, BTC’s price reaches the oversold region of the market as Bitcoin continues bullish run. The implication is that the selling pressure has reached bearish exhaustion. In other words, the market is likely to resume upward. Conversely, as price broke below the moving average, the pressure may persist.
Looking to buy or trade Bitcoin (BTC) now? Invest at eToro!
68% of retail investor accounts lose money when trading CFDs with this provider
Read more:
• How to buy Bitcoin
• How to buy cryptocurrency
Join Our Telegram channel to stay up to date on breaking news coverage