Join Our Telegram channel to stay up to date on breaking news coverage
BCOUSD Price Analysis – August 04
The Bears may further push down the Brent Oil price to reach the demand level of $64 provided there is an increase in the Bears’ pressure.
BCO/USD Market
Key levels:
Supply levels: $70, $79, $85
Demand levels: $64, $58, $49
BCOUSD Long-term Trend: Ranging
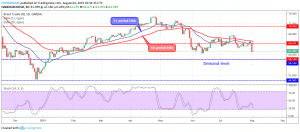
Brent Crude Oil continues ranging on the long-term outlook. The sideways movement continues in the Brent crude oil market. The Brent Oil price is moving around the demand level of $64. The Bulls have not been able to push up the price to reach the supply level of $70. Likewise, the Bears have no pressure to push the price down to demand level of $64.
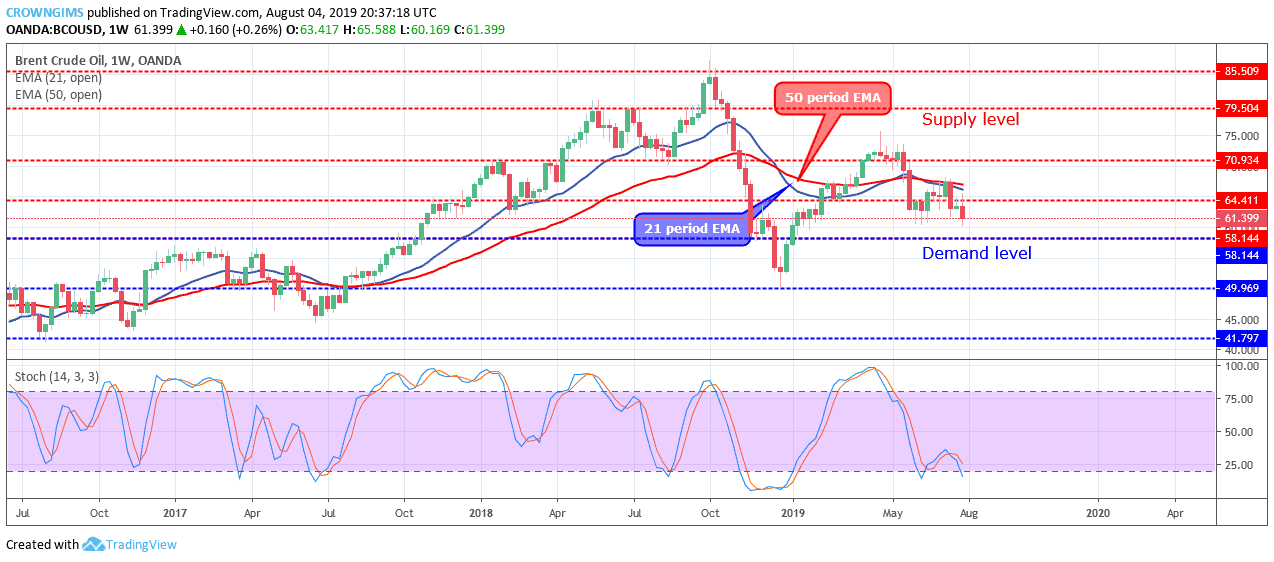
Brent Crude Oil price initially moved up last week but later the market closed with the price below the $64 level. The price is trading below the 21 periods EMA and 50 periods EMA and the two EMAs are gradually separating from each other which connote gradual increase in bearish momentum in the BCOUSD market. The Stochastic Oscillator period 14 is at 25 levels with the signal lines bending down to connotes sell signal. The Bears may further push down the Brent Oil price to reach the demand level of $64 provided there is an increase in the Bears’ pressure.
BCOUSD medium-term Trend: Ranging
Brent Crude Oil is ranging on the daily chart. The Bulls’ and the Bears’ momentum are still at equilibrium in the Brent Oil market; that is why the sideways movement continues. On August 01, the Bears gained momentum and the price dropped, this is noticed with the formation of the daily strong bearish candle.
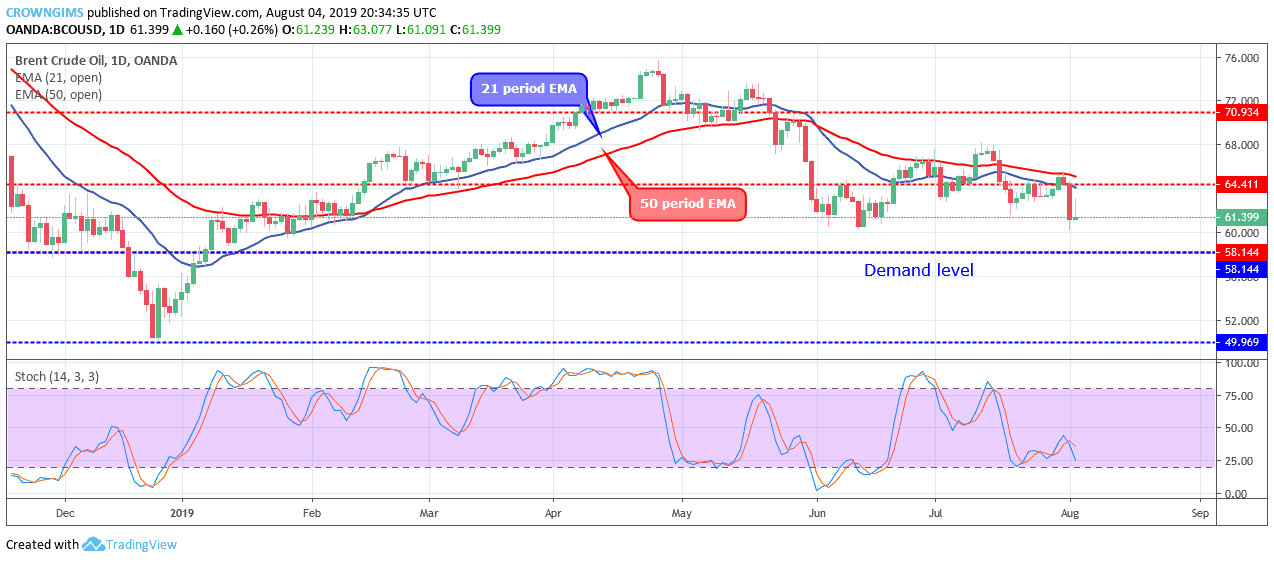
The price is currently trading below 21 periods EMA and the 50 periods EMA. The Stochastic Oscillator period 14 is at 25 levels with the signal lines pointing down to indicates sell signal and reduction in price.
Please note: insidebitcoins.com is not a financial advisor. Do your own research before investing your funds in any financial asset or presented product or event. We are not responsible for your investing results.
Join Our Telegram channel to stay up to date on breaking news coverage