Join Our Telegram channel to stay up to date on breaking news coverage
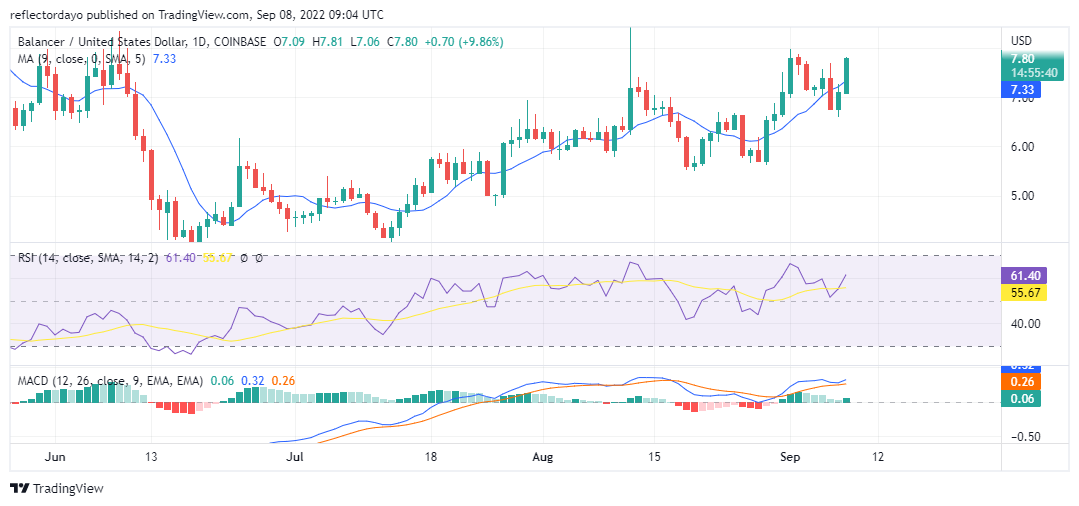
The price action of BAL/USD breaks the $7.000 resistance level on the 31st of August and it continued above it on the first of September. The next day marks the beginning of a brief period of market resistance from the sellers. This managed to bring the price below the $7.000 resistance level on the 6th of September. This brief bearish price retracement formed a new support level on the following day (7th of September) at $6.74000.
Currently, the price level is $7.79000. On a wide view of the chart, this market is with higher lows and this is a sign of an up-trending market. Buyers are stronger than the buyers
Balancer Market Price Statistic:
- BAL /USD price now: $7.790000
- BAL/USD market cap: $ 337,923,408
- BAL/USD circulating supply: 43,720,225.94
- BAL/USD total supply: 52,022,463
- BAL/USD coin market ranking: #99
Key Levels
- Resistance: $8.000, $8.500, $9.000
- Support: $6.7400, $6.000, $5.5000
Your capital is at risk
Balancer Market Price Analysis: The Indicators’ Point of View
The RSI line rose to 66% on the first of September. That was the day we had a very bullish candlestick. That candle even went as far as testing the $8.0000 resistance price level. That also marked the beginning of the brief bearish market. The RSI line has recovered to a 61% strength level. In the MACD, today’s green histogram shows the bullish vigour in the market, after the momentum weakens for six days.
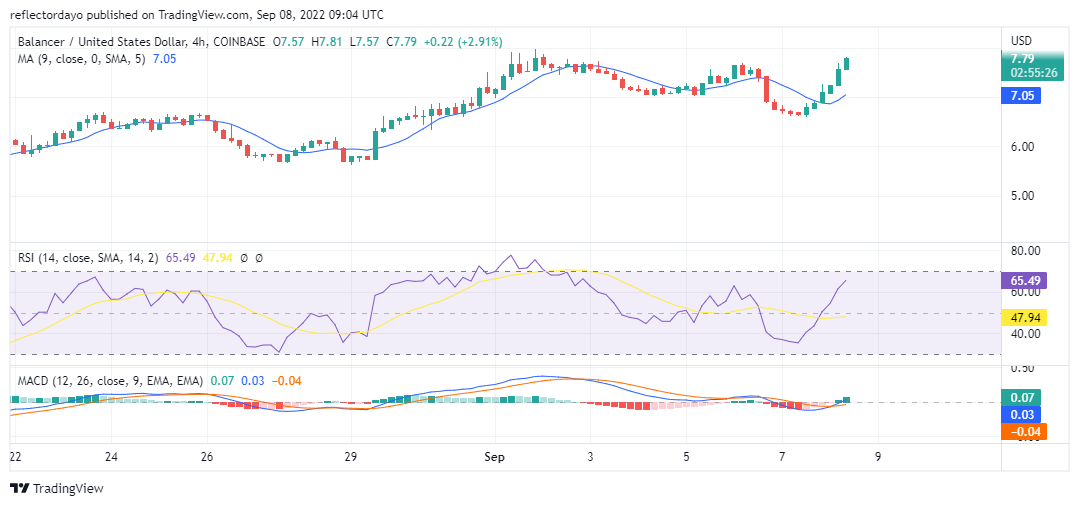
Balancer: BAL/USD 4-Hour Chart Outlook
The first 4-hour session opened with a marubozu candlestick which is a sign of bulls dominating the market for the very session. Bears came into the market by the second and third sessions but they did not affect the market much. The market still shows bullish momentum. The RSI and MACD in this timeframe show that the market is just recovering from the weaker zone.
Related
Join Our Telegram channel to stay up to date on breaking news coverage