Join Our Telegram channel to stay up to date on breaking news coverage
The daily chart reveals that the Algorand (ALGO) price prediction slides below $0.35 after rejection at the $0.36 level.
Algorand Market Price Statistic:
- Algorand price now: $0.34
- Algorand market cap: $2.4 billion
- Algorand circulating supply: 6.93 billion
- Algorand total supply: 7.1 billion
- Algorand coin market ranking: 29
ALGO/USD Market
Key Levels:
Resistance levels: $0.40, $0.42, $0.44
Support levels: $0.30, $0.28, $0.26
Your capital is at risk
As revealed by the daily chart, ALGO/USD is rolling down within the market with a loss of 1.58%. Meanwhile, the current downfall was expected as the altcoins were hitting huge counters, and the market had to come under selling pressure. However, should Algorand slide below the 21-day moving average, the bears might dominate the market.
Algorand Price Prediction: What to Expect from ALGO
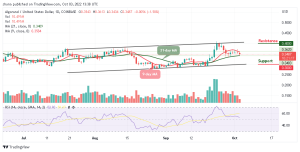
On the upside, a sustainable move above the 9-day moving average may ease the downward trend and create momentum for the bulls with the focus to move the Algorand price to the next resistance levels of $0.40, $0.42, and $0.44 respectively. At the moment, the technical indicator Relative Strength Index (14) remains below 60-level, which indicates that the downward momentum may come to play out.
Therefore, in as much as the 9-day moving average stays above the 21-day moving average, the coin may continue to follow an uptrend or remain within the consolidation area. In addition, it is good to note that the recent consolidation within the channel is necessary for the bullish action. Therefore, the support levels could be found at $0.30, $0.28, and $0.26.
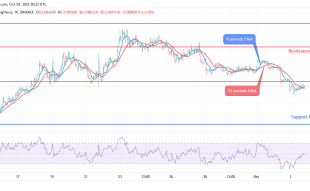
Against Bitcoin, the market may continue to follow the downtrend and a short-term bearish breakout is most likely to play out because the technical indicator Relative Strength Index (14) is moving below the 60-level and when turning downward, the price could break below the 21-day moving average to find the nearest support level at 1700 SAT.
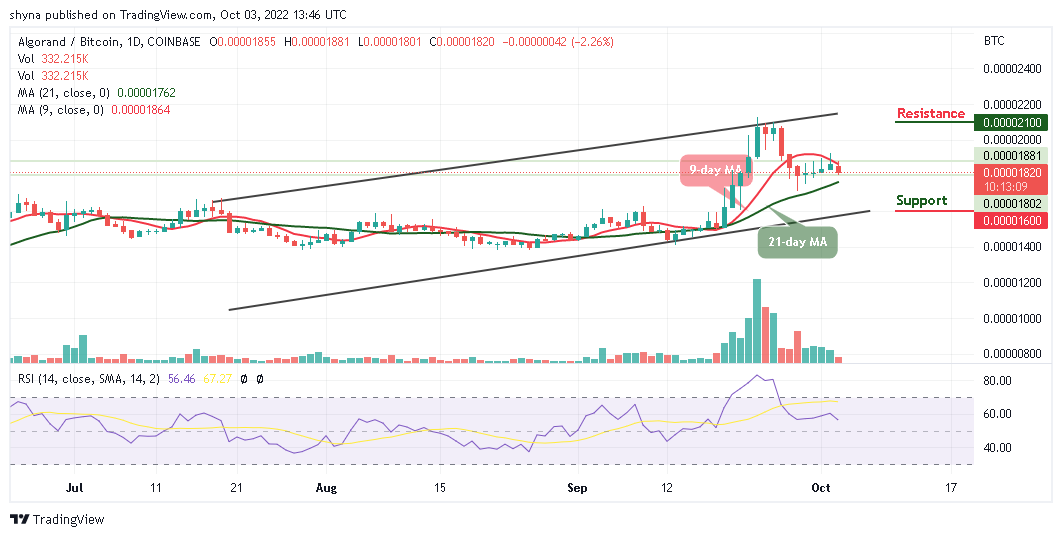
Therefore, if the buyers could gather and succeed in breaking above the 9-day moving average once again, the market price may likely touch the next resistance level of 2100 SAT and above. Meanwhile, a retest could lower the price to the support level of 1600 SAT and below.
Join Our Telegram channel to stay up to date on breaking news coverage