Join Our Telegram channel to stay up to date on breaking news coverage
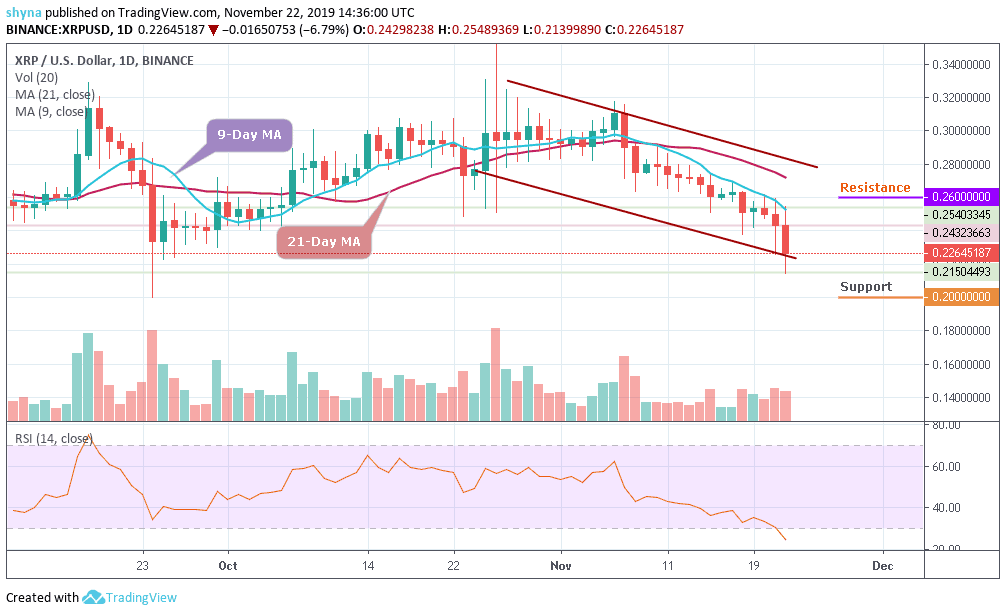
Bitcoin (BTC) Price Prediction – November 23
Bitcoin’s volatility has taken strong downward momentum as the price dropped below $7,300. The carnage spread over two days with more than $1000 drop in price.
BTC/USD Long-term Trend: Bearish (Daily Chart)
Key levels:
Resistance Levels: $8,000, $7,500, $7,000
Support Levels: $6,400, $5, 900, $5,400
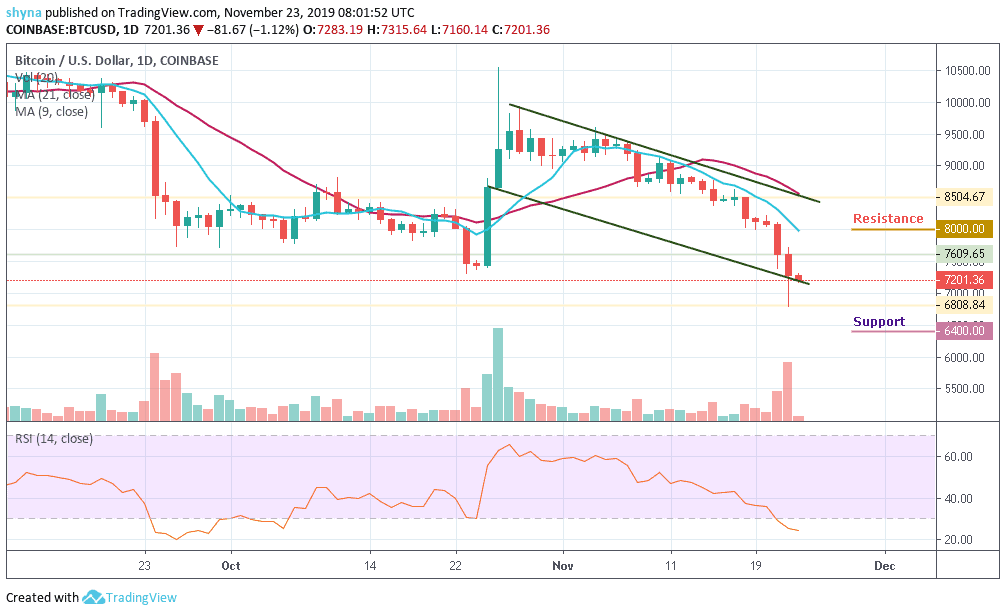
BTC/USD records the new 90-day low as it breaks in despair. The coin was unable to maintain the peak, slides down recklessly as it breaks below the 9-day and 21-day moving averages at $8,000 and $7,000 rapidly without a halt. This break in the market should be quite dense as we approach the end of the current year and we think the market will plunge completely to the point where it has progressed.
Moreover, Bitcoin (BTC) is leading the market in fresh declines during the European session. In the last couple of days, the largest cryptocurrency in the world has slipped under $8,000 and seeking support above $7,000. Today, as the market opens, the coin is trading around $7,201 following a 1.12% loss on the day. The currency now trades with ultimate selling pressure as it trades close to $7,000 after having grown from the manhole at $6,808.84.
However, the main resistance for the bulls is near the $8,000, $8,500 and $7,000 levels. Conversely, there could be more losses if there is no break above $7,600. The main supports on the downside are near $6,800. If there is a downside break below $6,500, the price may accelerate decline towards the $6,300, $5,900 and $5,400 support levels. The RSI for BTC/USD is currently within the oversold territory.
BTC/USD Medium-Term Trend: Bearish (4H Chart)
BTC has recently dropped below $7,500 and found support at $7,300 but yet to surge above $7,500. In the last 4 hours, BTC has decreased to about 0.97% from its high price level of $7,283.30. Bitcoin’s current price is proving how bearish the market is as the coin is even below its 21-day moving average. The coin is trading under selling pressure.
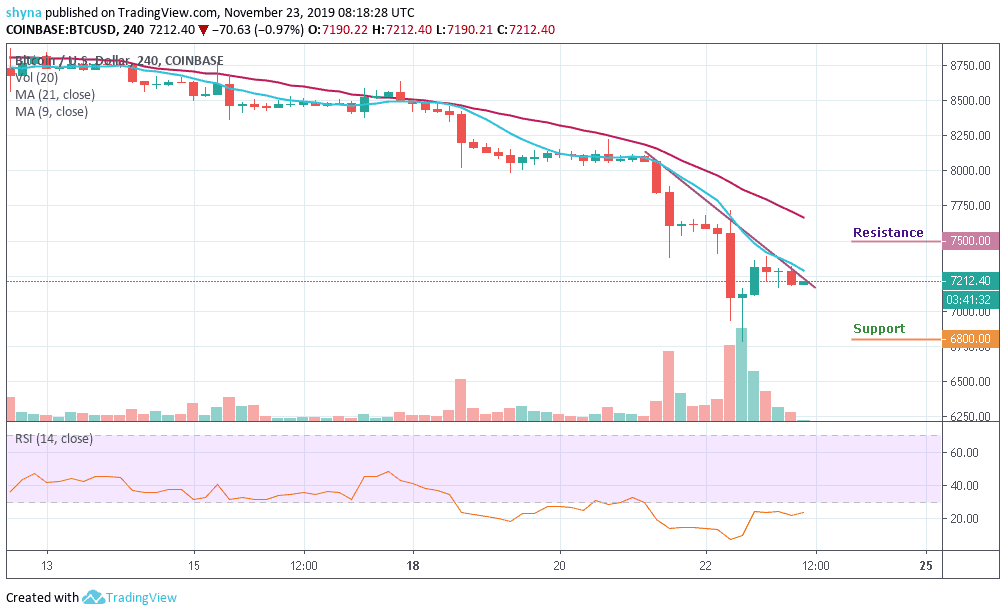
Bitcoin continues to weaken and keeps forming channels down on the 4-hour chart on November 17, while the price actions continue to face lower channel support. The RSI (14) of the main cryptocurrency is moving in the same direction within the oversold zone. Bitcoin may face resistance at $7,500 and $8,000, while the nearest support levels may likely be at $6,800 and $6,300 respectively.
Please note: Insidebitcoins.com is not a financial advisor. Do your research before investing your funds in any financial asset or presented product or event. We are not responsible for your investing results.
Join Our Telegram channel to stay up to date on breaking news coverage