Join Our Telegram channel to stay up to date on breaking news coverage
BCH Price Prediction – November 5
Bitcoin Cash continues to lag as the technical indicator suggests that lateral trade will prevail in the short term.
BCH/USD Market
Key Levels:
Resistance levels: $320, $330, $340
Support levels: $260, $250, $240
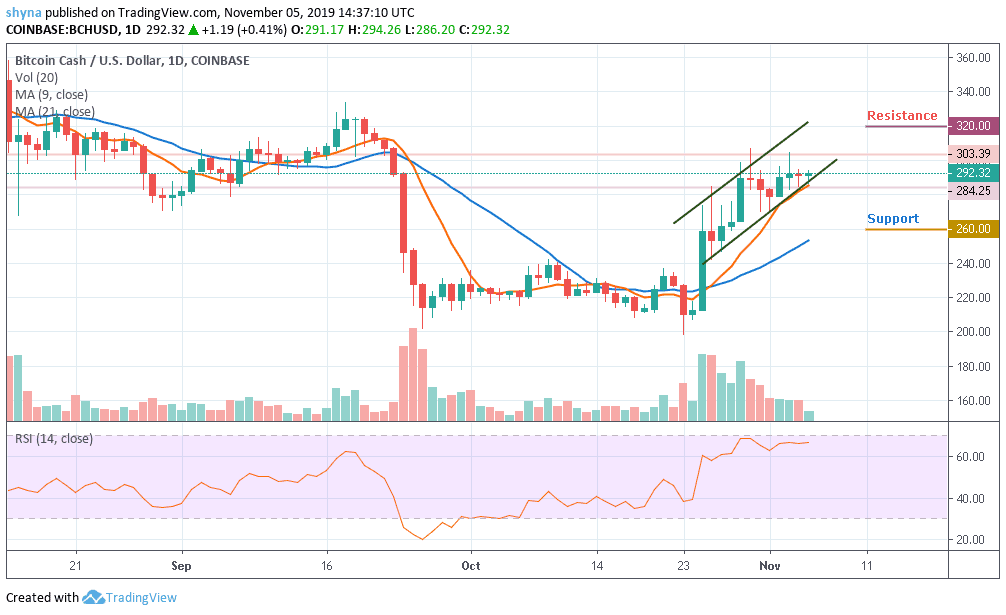
Bitcoin Cash price battled with the bear from the opening hours. The loss in the price was voluptuous. However, BCH/USD is now seen recovering from the heavy price drop. More so, the speculation is that the pair would keep the upsurge intact and bring a flourishing future. A couple of days ago, BCH price was seen touching a high at $303.39 and a low at $284.25.
In addition, BCH/USD seems to be picked up its pace and has risen above $294 today before dropping but the coin is still moving above the 9-day and 21-day MA. However, if we observe the movement of the coin, the Bitcoin Cash has been showing an uneven movement with several rises and falls. We will discover that the coin has not been able to maintain a consistent bullish run. It may start to show signs of a downward movement slowly from the latter part of the day.
On the upside, the bulls could break the initial resistance at the $320 price level, and approach to retest the $330 and $340 resistance levels. The primary support holds ground at $280 while $275 will try to stop overstretched losses in case of a reversal. Therefore the primary supports at $260, $250 and $240 are very important. Meanwhile, the RSI (14) suggest that sideways trading will prevail in the near term.
Against Bitcoin, the price has been rising against Bitcoin a few days ago but as it appeared, though trading above the 9-day and 21-day MA, there’s a low amount of buying pressure in the market. BCH price is waiting for the break above the ascending channel to touch the nearest resistance level of 0.0325 BTC.
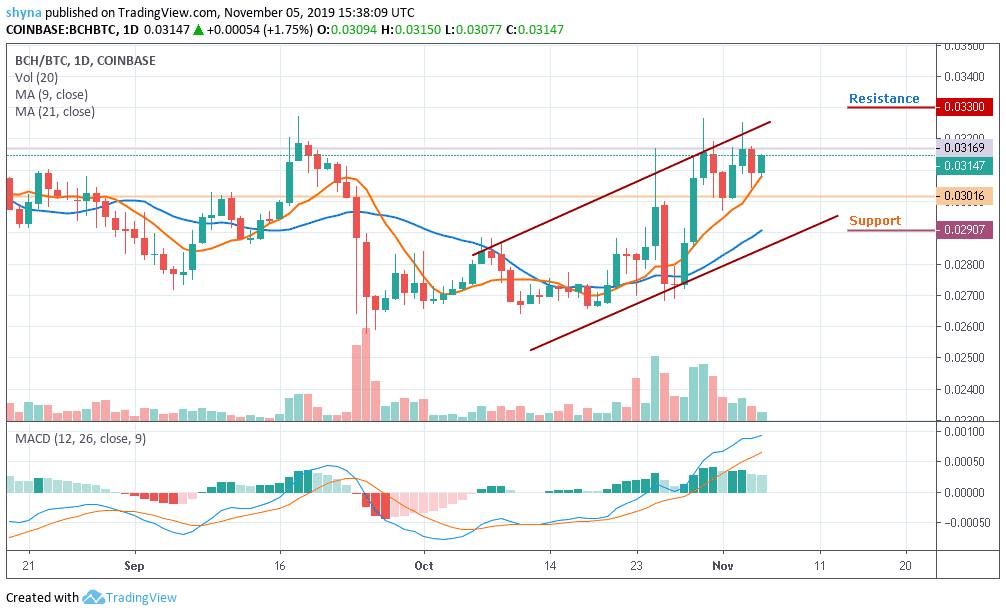
Meanwhile, should the bulls fail to push the market upward; the price could easily fall to 0.0301 BTC support and the resistance to watch are 0.033 BTC and above. More so, while trading at 0.0301 BTC support, a bearish continuation may touch the 0.0290 BTC respectively.
Furthermore, a breach could slump the market to 0.0280 BTC support, creating a new low below the rising channel. Whereas, the MACD signal lines are still on the positive side giving bullish signals.
Please note: Insidebitcoins.com is not a financial advisor. Do your research before investing your funds in any financial asset or presented product or event. We are not responsible for your investing results.
Join Our Telegram channel to stay up to date on breaking news coverage