Join Our Telegram channel to stay up to date on breaking news coverage
ETH Price Analysis – July 7
Ethereum (ETH) looks extremely bearish against the US Dollar (USD) but it looks even more bearish against Bitcoin (BTC). This is because for the past few weeks, ETH/BTC has been incredibly close to breaking a key support.
ETH/USD Market
Key Levels:
Resistance levels: $360, $380, $400
Support levels: $250, $230, $210
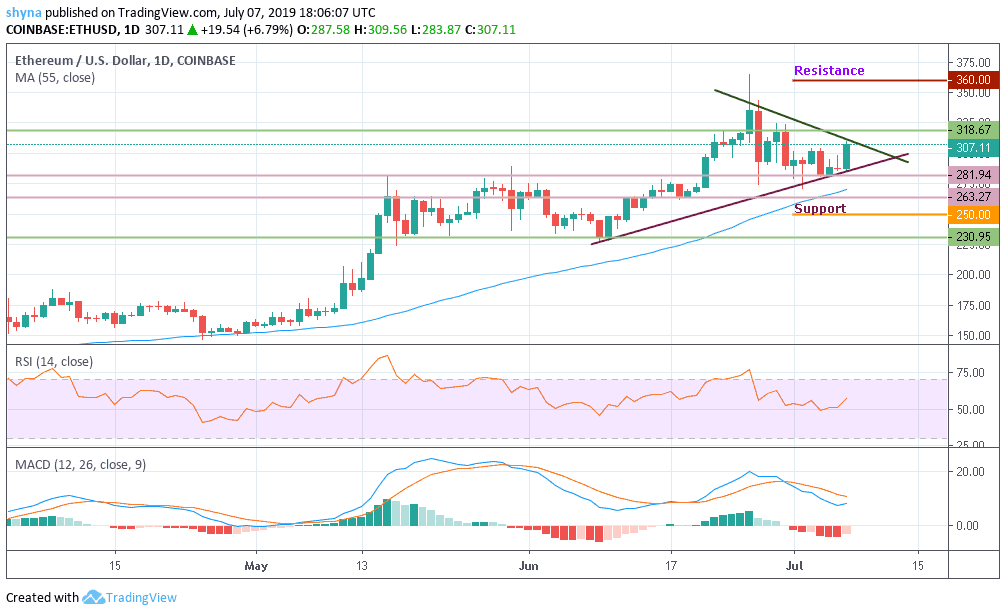
The Ethereum price is currently trading above the $300 level and the 55-day moving average. If there is a bullish break above the resistance level at $320, Ethereum’s price could continue to accelerate in the short term. The next stop for the bulls could be $340, followed by $360, $380 and $400 respectively.
Conversely, if there is no increase above $320, the price could fall below the support level of $310. If there is a downside break, there could be sharp losses below the $300 and $280 levels. In the mentioned case, the price may even slide below the $250, $230 and $210 support levels. The MACD for ETH/USD is slowly moving back in the bearish zone while the RSI currently below the 60 level, with a few negative signs.
ETH/BTC Market
Looking at the chart, ETH/USD seems to be following in the footsteps of Bitcoin (BTC) replicating its every move but most of the time this is not the case. Usually, we see Ethereum (ETH) rise higher when Bitcoin (BTC) rises and fall lower when Bitcoin (BTC) falls. This means that if the sideways movement in ETH/BTC ends, we will see it end this pace conformity with Bitcoin (BTC).
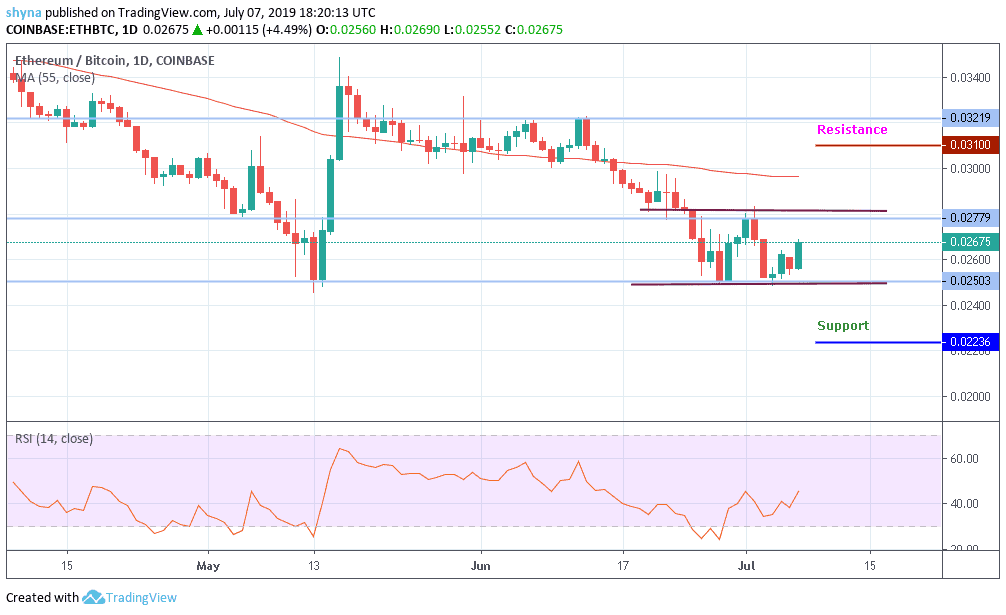
Meanwhile, should in case the ETH/BTC move and cross the upper part of the channel pattern to retest the 0.027BTC, the RSI will continue to give buy signals which could further turn the market bullish. However, one can expect potential resistance at 0.031BTC, 0.032BTC and 0.033BTC levels once the upward trends are confirmed. Alternatively, the support at 0.022BTC, 0.023BTC and 0.024BTC may likely be visited.
Please note: insidebitcoins.com is not a financial advisor. Do your own research before investing your funds in any financial asset or presented product or event. We are not responsible for your investing results.
Join Our Telegram channel to stay up to date on breaking news coverage